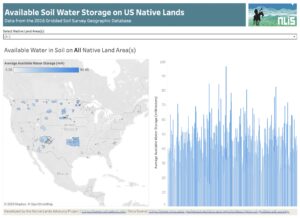
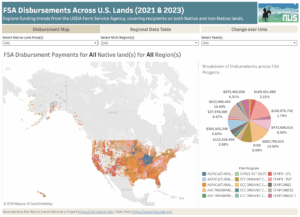
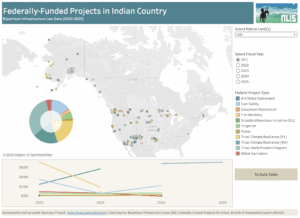
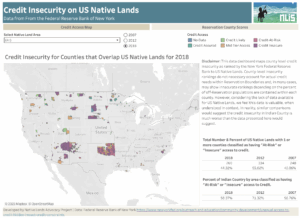
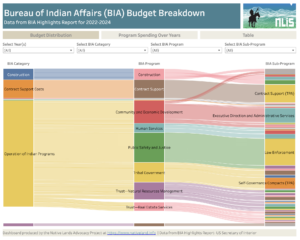
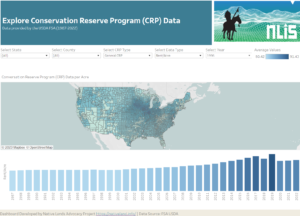
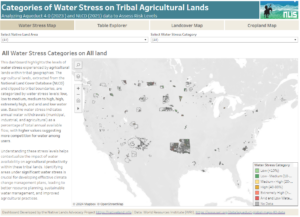
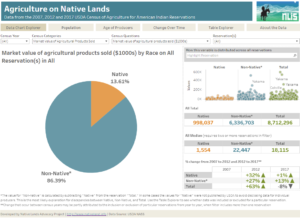
Dashboards make large and complex datasets easier to visualize, sort, filter, compare and analyze, making the data more understandable and actionable. Once you have the desired filters set they can be easily screen captured and pasted into a slide show, report, or social media post.