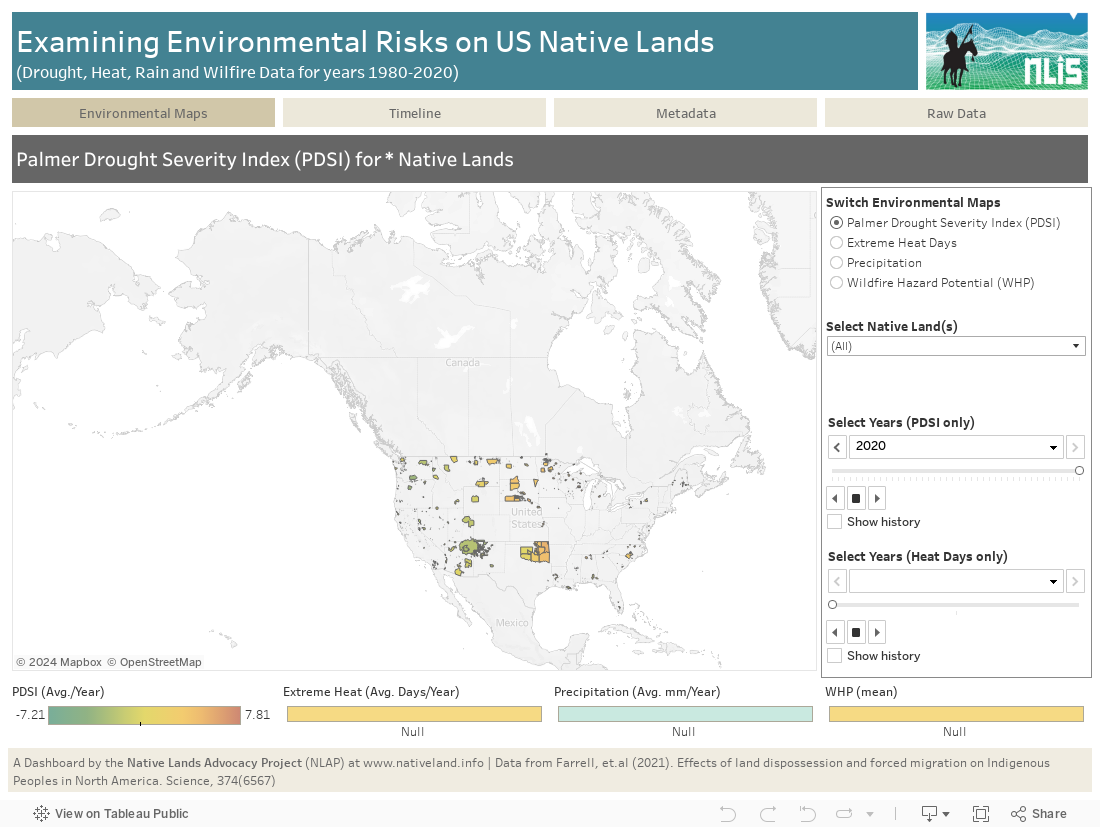
This dashboard shows key environmental risks data for US tribal lands to help tribes monitor and assess risks and incorporate them in their land planning and decision-making. Data comes from the recent article: Farrell, J., Burow, P. B., McConnell, K., Bayham, J., Whyte, K., & Koss, G. (2021). Effects of land dispossession and forced migration on Indigenous peoples in North America. Science, 374(6567). It was reprocessed by the paper’s authors to feature on our site and help directly support tribal land planning.
Data comes from the authors of recent article: Farrell et.al. (2021). Effects of land dispossession and forced migration on Indigenous peoples in North America. Science, 374(6567).
To see a summary of the article, click here.
Firstly, we had been contacted to host their raw data on our CKAN Data Portal. It started a conversation around turning the data used in the paper into an actionable data dashboard in order to direclty benefit tribes and sovereign land-planning. The original data of the paper was looking at a few environmental risks and how it impacted tribes based on their original versus post-displacement locations. The team decided to focus on four key environmental risks (Heat, Drought, Precipitation and Wildfire Potential) and modern tribal geographies to build a tool that directly benefit tribal land planning.
Boundary data used to define summary areas was obtained from the 2019 US Census Bureau’s TIGER/Line Shapefile for American Indian areas in the United States which includes both American Indians and Alaskan Natives. However, the total land areas displayed on our views depends on the represented areas in the associated dataset. Here, the views for Drought and Heat Days show 20 years of data (1980-2020) for 561 unique land areas, as they do not include Hawaii and Alaska, whereas data for Precipitation and Wildfire, which is only available for one year, include these territories so they feature 858 unique features or land areas.
Environmental risks are extremely important factors to consider for sovereign native land planning, because of the changing climate and the need for precise and accurate information to prepare and mitigate the changes, but also because tribes are often disproportionately affected by climate risks, as demonstrated by work like the one from this article. This makes data from this dashboard particularly important, especially because there is so little information available for tribal geographies to support tribes in their planning effort. This data can help monitor environmental risks, evaluate the impact of tribal policies, complete Integrated Resource Management Plans and Climate Adaptation Plans, and much more.
However, climate data is limited and limiting in essence. There is so much more to climate change than rising global temperatures and resulting weather unbalances and disasters. Climate change affects communities; their food-system, their habitat, their health and the profound relationships they keep within the land. It also affects cultural practices as these are embedded in the relationship with the land in the first place. In turn, culture also plays a key role in helping communities through difficult times and can help foster important information to face climate change. Additionally, climate change is caused by the worldwide predominance of commodified relations with the earth that have been imposed and continue to be maintained by colonial powers of European descent, and by a cultural model which brings the voices of White capitalist patriarchal to take more space than other voices, including indigenous voices. This colonial world economy and world culture hinders indigenous and other alternative voices in the conversation around climate and how we can better take care of the Earth for the next generations to come.
At NLAP, we know and recognise the complexity of the climate question, especially as it expresses in Indian country. The data represented here does not capture, nor does it aim to capture this bigger picture. The data represented here is not meant to reduce the climate question to a series of environmental risks to address in silos. Instead it provides one small piece of the puzzle to simply help support tribes as they exercise their sovereignty in land planning and need data to assert their claims. We hope you will find it useful.
The data in these dashboards comes from the recent article: Farrell, J., Burow, P. B., McConnell, K., Bayham, J., Whyte, K., & Koss, G. (2021). Effects of land dispossession and forced migration on Indigenous peoples in North America. Science, 374(6567). It was reprocessed by the paper’s authors to feature on our site and help directly support tribal land planning. Here is the metadata which describes their methodology:
Heat Days
We construct a metric following Dahl et al.’s measure of the average number of days per year between 1971
to 2000 with a Heat Index greater than 100 degrees Fahrenheit (74). To do so, we use the daily maximum
temperature gridded (4km resolution) across the continental US from gridMET (41). For each grid cell, we
aggregate the number of days in a year that exceed 100 degrees Fahrenheit. We then aggregate the mean of
hot days over all grid cells contained in the polygon (weighted by the area of the cell contained within the
boundary), and finally, over the available years of 1979-2000, we use the average number of mean hot days
per year for each tribe in historical and present-day time periods.
Drought
We measure drought conditions using the Palmer Drought Severity Index (PDSI). The PDSI is a unitless
measure which assesses exposure to drought and ranges from -10 (extreme drought) to +10 (extreme wet). We
gather weekly PDSI measures gridded (4km resolution) across the continental US from gridMET (41). First,
we construct weekly PDSI averages using GIS to spatially intersect CCE or census tribal area boundaries
with gridded PDSI. Second, we calculate annual averages of weekly drought for each tribe from 1980 to 2020.
Precipitation
Oregon State University’s PRISM Climate Group calculates the annual average precipitation (millimeters)
over 30-year time periods. We use data that is calculated between 1981 and 2010 (45). We use a raster with
a 4km extent, which we subset to the area of each polygon. The precipitation used for each tribe is the the
mean value found in each cell contained within an area boundary, weighted by the fraction of grid cell area
within the tribal area boundary.
Wildfire Hazard Potential
A changing climate is altering wildfire behavior in the US, and particularly in the Western US (46, 75).
We construct a measure of wildfire risk using a gridded (270 meter) index called Wildfire Hazard Potential
(WHP) (47). The WHP is a discrete scale from 1 (very low fire hazard potential) to 5 (very high hazard
potential) designed to inform fuel planning efforts. We choose this measure because it synthesizes many
ecological, geographic, and atmospheric factors into a single index. We calculate the mean WHP of all grid
cells within all of a tribes CCEs and Tribal census areas.