Lost Agriculture Revenue Database (L.A.R.D)
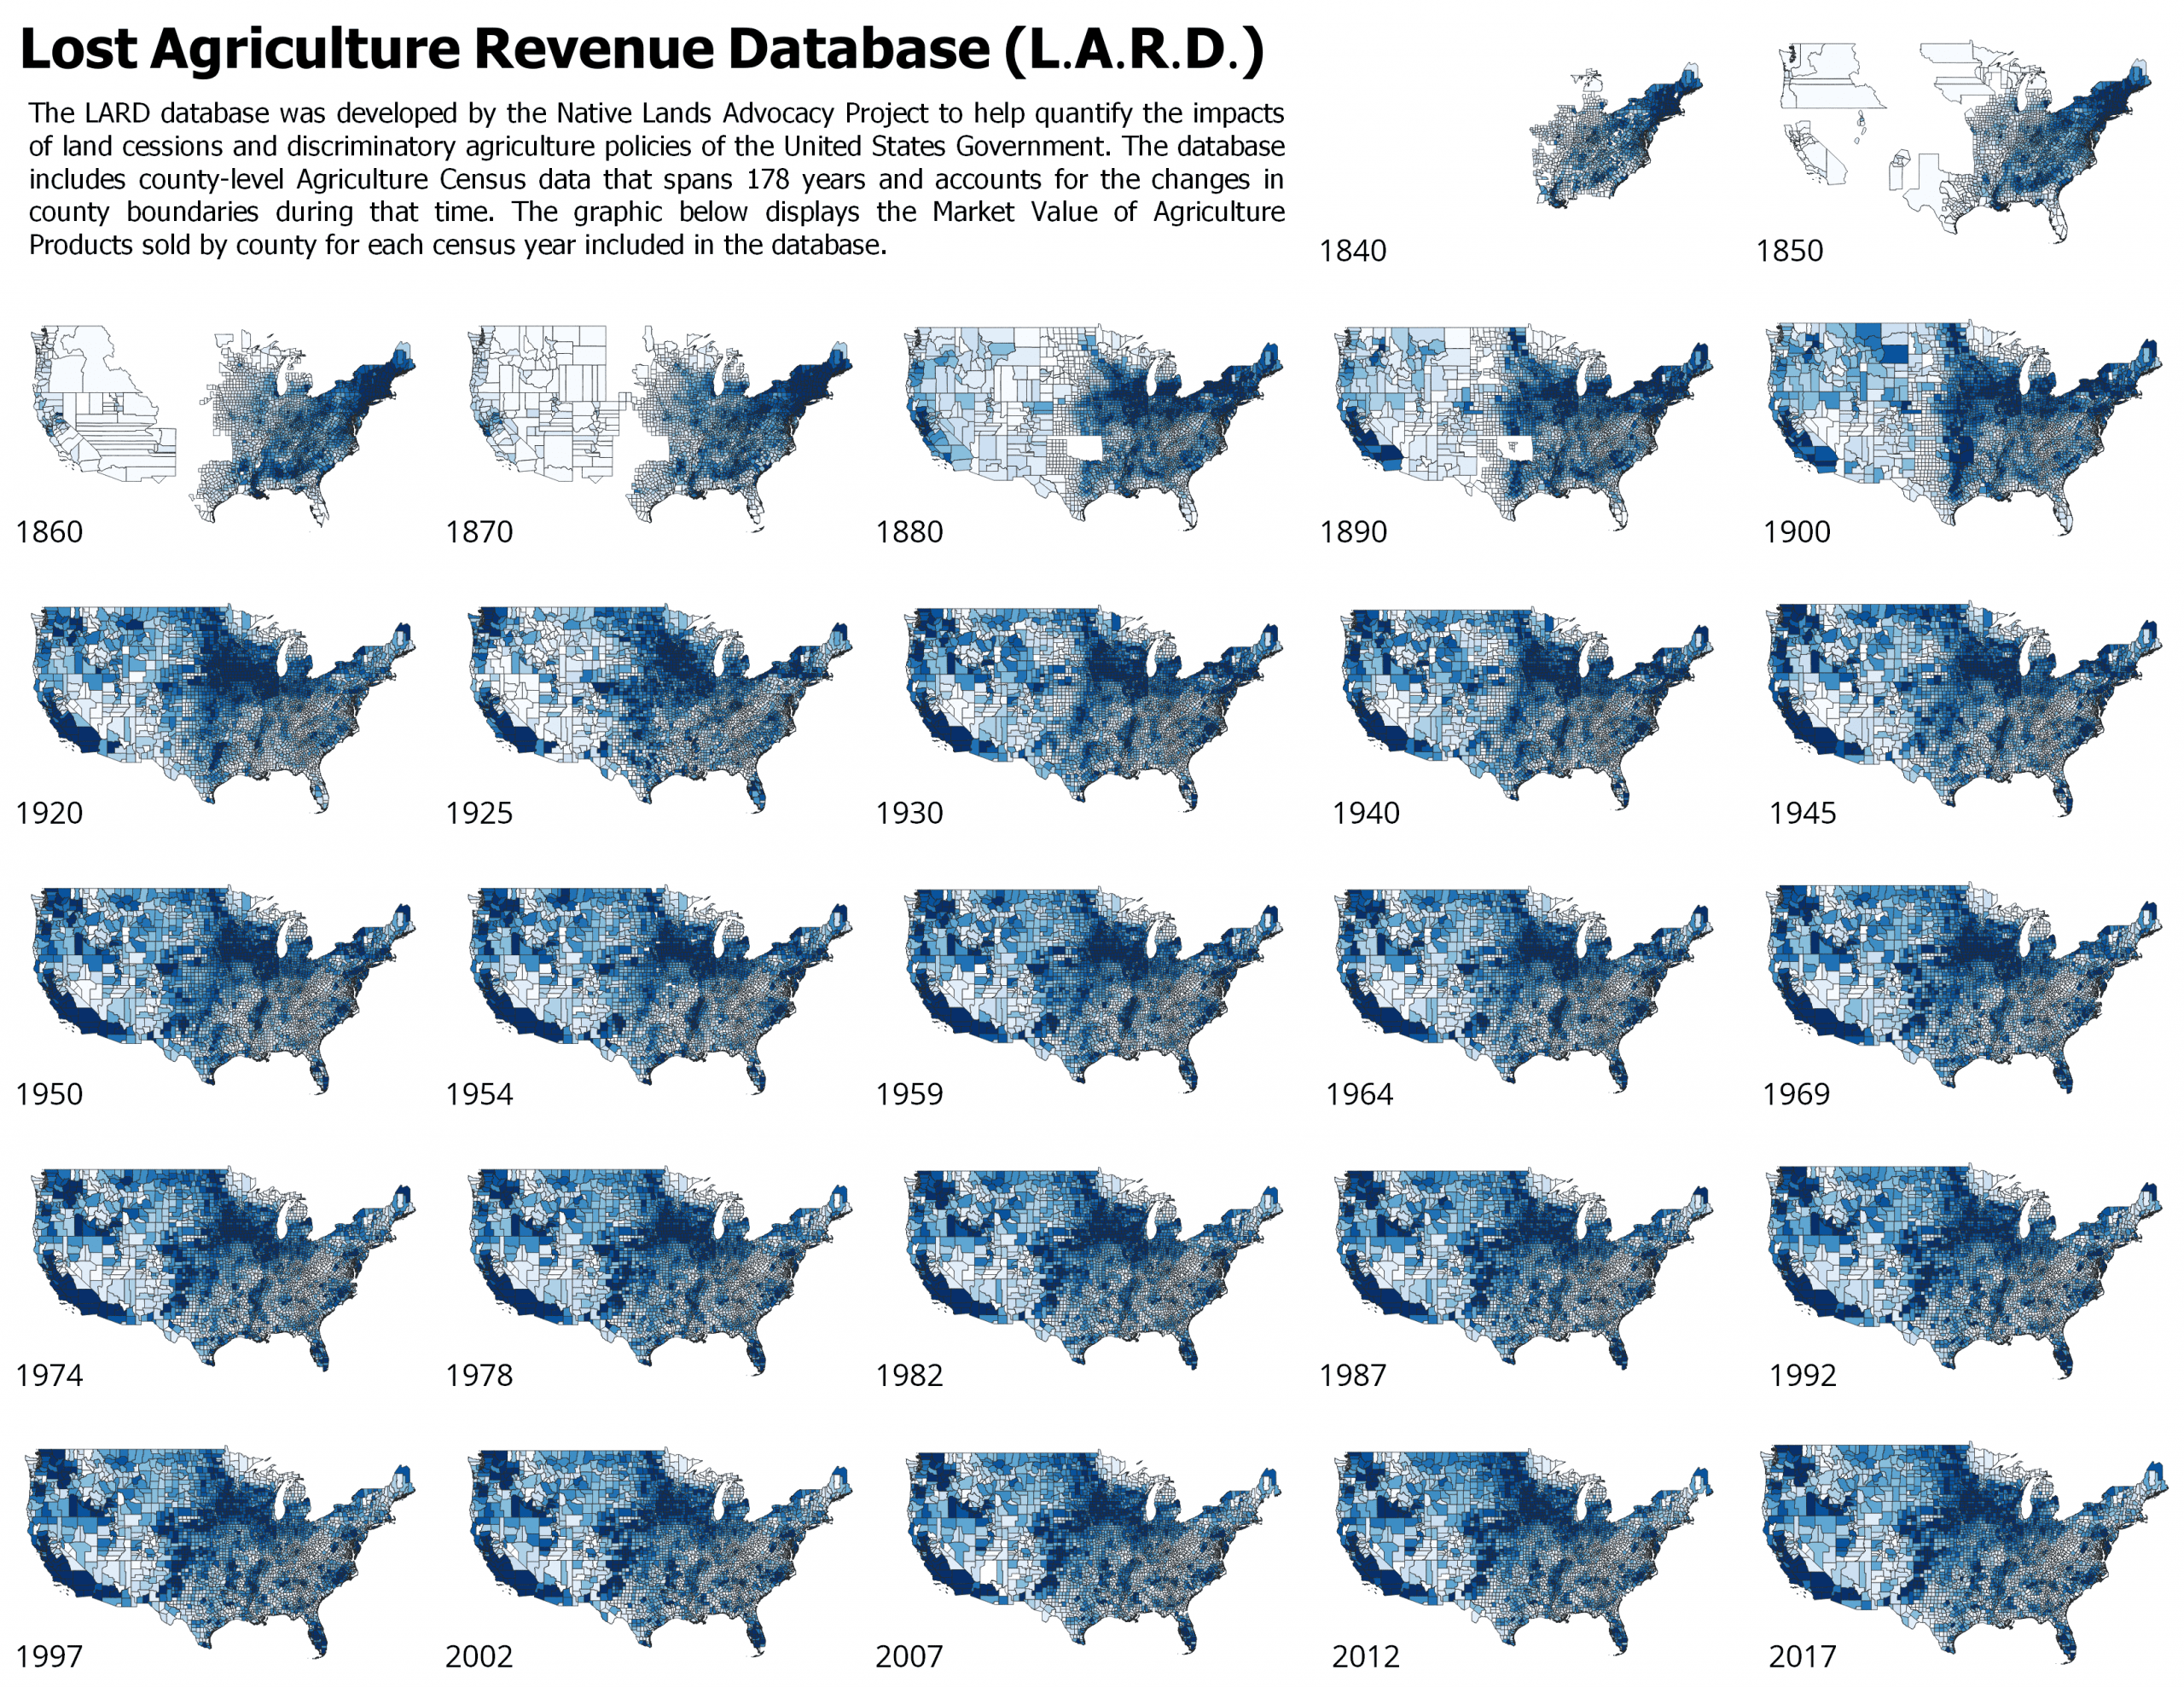
The L.A.R.D. database was developed by the Native Lands Advocacy Project to help quantify the impacts of land cessions and discriminatory agriculture policies of the United States government. The name of the database is a double-entendre of the Lakota word Wasi’chu which translates as “takes the fat” and was used by the Lakota and other tribes to refer to white settlers. The database utilizes a novel approach to disaggregate 178 years of county-level agriculture census data, making it possible to aggregate the data for geographies that overlap county boundaries, such as Reservations, treaty territories, land cessions, etc.
Why did we create the Lost Agriculture Revenue Database?
While Native Americans and Native American Tribes enjoy a degree of political sovereignty it is compromised by the fact that most tribal lands and resources are held in trust by the Federal Government. Because of this unique relationship the US Supreme Court has repeatedly affirmed and upheld the responsibility that the federal government has to protect the tribal lands and assets and ensure they are used for the benefit of native people. This responsibility the federal government has to native peoples and tribes is known as the Trust Doctrine.
But how do we know whether the federal government is really protecting tribal lands and assets to ensure they are used for the benefit of native people and what metrics can we use to monitor and test this? Since the majority of native lands are located within agricultural regions of the country, it only makes sense that agriculture revenue derived from native lands would be an important way to measure the degree to which Native people are the primary beneficiaries of their lands and assets. But how do we measure this? Especially, when the federal government has largely failed to report agriculture data for native lands for nearly 100 years.
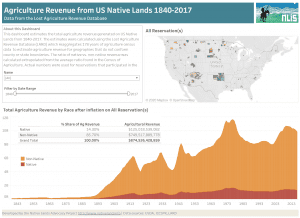
To its credit, the federal government did conduct a limited census of Agriculture on a handful of Native American Reservations starting in 2007 and then again in 2012 and 2017 with even more Reservations. However, these census’ only reported data for native producers even when the majority of agricultural income was being captured by non-natives. To make up for this blind-spot in the data, we performed our own calculation of the data and added a category for non-native producers (see our dashboard with the 2012 and 2017 data here). The results were startling and confirmed what was well known by most Native people; that non-native farmers and ranchers were collecting the vast majority of agriculture revenue on native lands, in fact, between 2012 and 2017 they collected an average of 86% of the revenue. But what does this amount to nationwide over time? We believe answering these questions are critical for not only understanding the multi-generational impacts of discriminatory and exclusionary policies, but it also can serve as a baseline to what will be required to make native people and their communities whole again. Additionally, we hope this database will enable us to finally attach a dollar value to the wealth that was generated through agriculture from lands unjustly taken from native people and how this fueled the growth and expansion of the U.S. economy.
Table of Contents
How we created the L.A.R.D.
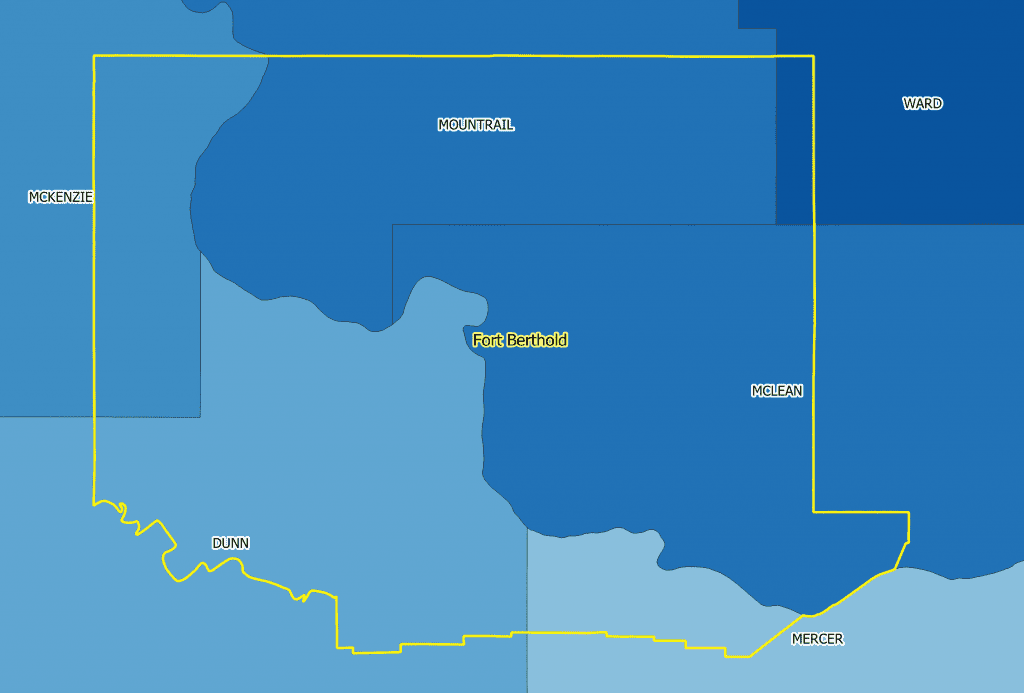
The image on the left illustrates the challenge of using county-level agriculture census data for native lands. In this example the Fort Berthold Reservation in North Dakota overlaps six different counties.
We identified all agriculture lands (cropland and pasture) within each county using the National Land Cover Database (NLCD). The NLCD is a seamless coast-to-coast raster layer that classifies various land covers and land uses. A raster layer is similar to a digital photograph made up up millions of pixels, where each pixel has a different color. In the case of a GIS raster image, each pixel constitutes a defined area on the ground and it is possible to assign each pixel a numerical value.
We then generated a count of the number of agriculture pixels in each county for each census year (since the county boundaries can change from one census to the next) and then classified the pixels within each county a dollar value based on its relative proportion of agriculture income.
Below (left) is the national map of agriculture lands (black) created from the NLCD overlayed with the 2017 county boundary map (yellow). Each pixel is assigned its relative proportion of the county’s agriculture revenue for that census year. The image (below right) is the same map but zoomed-in on the Fort Berthold reservation. Each pixel of the NLCD equals 30×30 meters on the ground. In total, the L.A.R.D. includes 27 national raster images or one for each census year between 1840 and 2017, a total of 28 Gigabytes.
To test the accuracy of the LARD we compared results with the agriculture revenue for 52 reservations reported in the 2012 and 2017 Census of Agriculture for American Indian Reservations. The data for this census is calculated from individual-level responses but aggregated at the Reservation-level (vs. the county). The median difference in agriculture income between the Census and the LARD for these periods was only 17%. Alternatively, it could be stated that the median accuracy of the LARD for the 52 reservations in 2012 and 2017 was 83%. Accuracy of a LARD query is dependent upon a number of factors, most importantly, it is dependent on how closely the boundaries queried match the county boundaries for any particular year (the LARD query should be 100% accurate if there is a 1:1 correspondence with county boundaries) and how evenly agricultural income is distributed across ag-lands (LARD assumes an even distribution).
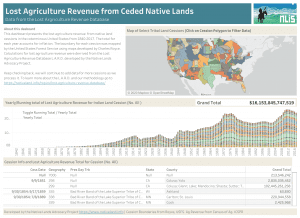
To query the L.A.R.D. we can load any boundary within the coterminous United States. Using a raster statistics algorithm the database will sum the value of all the pixels within that area for each raster layer which translates to the sum total agriculture revenue for that particular year. It repeats the process for each census year creating a table of census years and sums. With the data being regularly spaced over time, the database interpolates the total revenue for the years in-between each census period and then adjust the totals for each year to account for inflation. The results can then be graphed as demonstrated in the visualization below where we calculated total agriculture revenue for native land cessions between 1840 and 1897.
Related Data Dashboards
Related Blog Posts
Quantifying Disparities in Agricultural Revenue on Native Lands
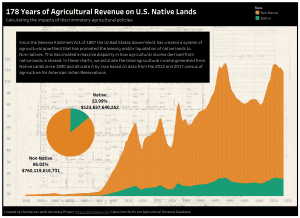
According to our Lost Agriculture Revenue Database, non-Native farmers have made $749,517,889,778 in agricultural revenue (85.7% of total revenue) on Native reservations since 1840, while Native farmers have made $125,018,539,082 (14.3% of total revenue). What factors contribute to this shocking disparity in agricultural revenue? And what do these numbers really represent for Native communities?
NLAP Presents Lost Agriculture Revenue Database to Oceti Sakowin Titunwan Lakota Oyate Treaty Conference – 12/16/2021
David Bartecchi, Director of Village Earth and its Native Lands Advocacy Project (NLAP), had the honor to present the project’s Lost Agriculture Revenue Database (LARD)

How Much Discriminatory Lending Practices Impact Agricultural Revenue on US Native Land
By Aude K. Chesnais Introduction: Lending and Debt on US Native Land In 2018, the Keepseagle settlement shed light on widespread lending discrimination across the
The General Allotment Act of 1887 Crippled Native Agriculture for Generations
Today, the US Bureau of Indian Affairs (BIA) holds 66 million acres of lands in trust for various Indian tribes and individuals. Approximately 46 million acres
Introducing the Native Land Information System
The Native Land Information System serves as a repository of learning resources, information, and data to help defend and protect Native lands for the benefit of Native peoples.

