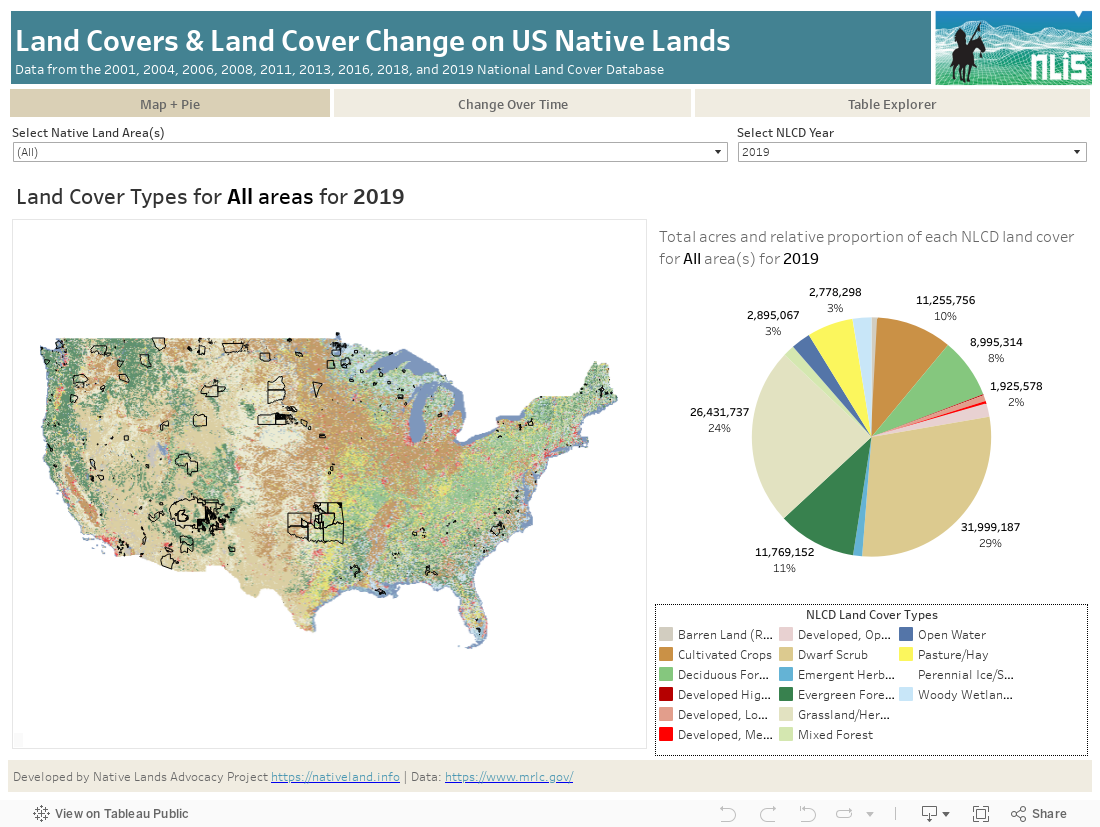
This data dashboard summarizes the total area for 16 land covers for 848 native land areas (reservations and off reservation trust lands) in the conterminous United States for 2001, 2004, 2006, 2011, 2013, 2016, and 2019.
The National Land Cover Database (NLCD) provides nationwide data on land cover and land cover change at a 30m resolution with a 16-class legend based on a modified Anderson Level II classification system. The database is designed to provide cyclical updates of United States land cover and associated changes. Systematically aligned over time, the database provides the ability to understand both current and historical land cover and land cover change, and enables monitoring and trend assessments. The latest evolution of NLCD products are designed for widespread application in biology, climate, education, land management, hydrology, environmental planning, risk and disease analysis, telecommunications, and visualization.
The NLCD is developed by the Multi-Resolution Land Characteristics (MRLC) consortium, a group of federal agencies who coordinate and generate consistent and relevant land cover information at the national scale for a wide variety of environmental, land management, and modeling applications. The creation of this consortium has resulted in the mapping of the lower 48 United States, Hawaii, Alaska and Puerto Rico into a comprehensive land cover product termed, the National Land Cover Database (NLCD), from decadal Landsat satellite imagery, and other supplementary datasets.
What land covers are found on Native lands in the coterminous United States? How are these land covers changing over time. How do land covers on Native lands compare to non-native lands? What trends appears for urbanization, forest cover, harvested cropland, etc? These are the types of questions that can be answered using this data dashboard. This data and dashboard can be used by individuals and tribes for assessment and planning related to agriculture, climate change, land use, disaster preparedness, economic development, and more.
Limitations
This dashboard aggregates data using the external boundaries of Native lands and tribal statistical areas and does not differentiate between fee and trust lands within those boundaries.