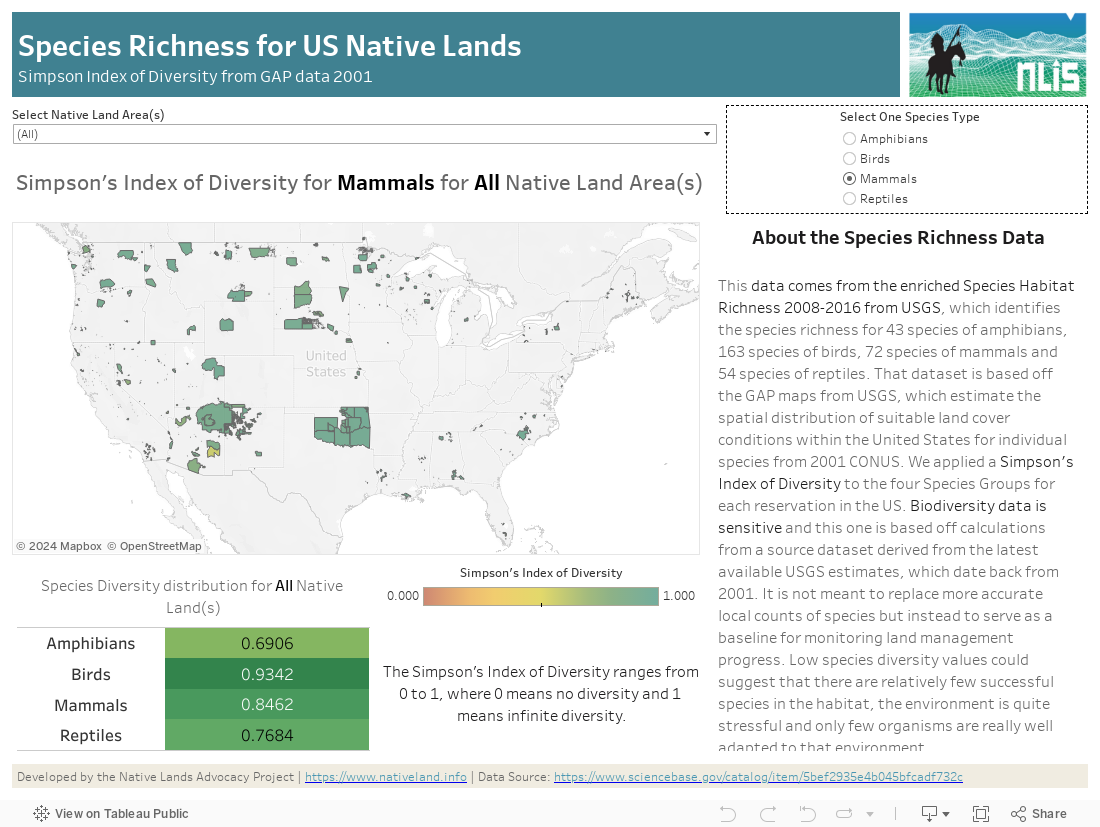
This data comes from the Species Habitat Richness 2008-2016 from USGS, which identifies the species richness for 43 species of amphibians, 163 species of birds, 72 species of mammals, and 54 species of reptiles. This dataset is an enriched output of the GAP Analysis Project from USGS, which estimates the spatial distribution of suitable environmental and land cover conditions within the United States for individual species from 2001 CONUS land conditions. We applied a Simpson’s Index of Diversity (1-D) to each of the four Species Groups for each reservation in the US, which gives an indication of diversity relative to the total number of species in each of the four Species Groups. Biodiversity data is sensitive and this one is based off calculations derived from USGS original estimates from the land cover in 2001. It is not meant to replace more accurate local counts of species but instead to serve as a baseline for monitoring land management progress.
Species Richness provides an estimate of fauna biodiversity in the US. As land stewards of more than 56 million acres, tribes play a prominent role in efficiently managing ecosystems, as seen in the various land restoration initiatives sprouting across Indian Country, guided by Traditional Ecological Knowledge and visions of thriving futures for their people. These efforts are impeded by a skewed agricultural system which stands as a legacy of allotment policies and a continuous mismanagement of Native lands by the Bureau of Indian Affairs and other federal agencies. Additionally, while the White House committed in December 2022 to elevate the visibility and use of Indigenous Knowledge in federal agencies, the road will be long to undo centuries of misuse and one-sided extractivism. As a result, tribes need all the information and data they can to enforce their sovereign rights to steward their own lands.
Due to the sensitivity of biodiversity data and the cultural uses attached to land, tribes also enforce their right for their own collected and culturally-specific data to be controlled by them. In response to historical patterns that have colonized data collection and used that data to inform decision-making (and continue to do so, as mining and other extracting industries can often buy their way into tribal land data), tribal data sovereignty can be reached by following a double data movement, where (1) Tribes build capacity to collect, analyze, and monitor their own data and (2) Data that is already in the public domain is made accessible at the tribal geography level. While we support the first movement by privately consulting with tribes on mapping their data, the information published on this site is meant to inform the second aspect of data sovereignty. By not releasing details on any specific species and focusing on baseline information of diversity for monitoring purposes, we also align this dashboard with our values and goals to support tribal sovereignty.
According to the USGS: “Gap Analysis Project (GAP) habitat maps are predictions of the spatial distribution of suitable environmental and land cover conditions within the United States for individual species. Mapped areas represent places where the environment is suitable for the species to occur (i.e. suitable to support one or more life history requirements for breeding, resting, or foraging), while areas not included in the map are those predicted to be unsuitable for the species. While the actual distributions of many species are likely to be habitat limited, suitable habitat will not always be occupied because of population dynamics and species interactions. Furthermore, these maps correspond to midscale characterizations of landscapes, but individual animals may deem areas to be unsuitable because of presence or absence of fine-scale features and characteristics that are not represented in our models (e.g. snags, vernal pools, shrubby undergrowth). These maps are intended to be used at a 1:100,000 or smaller map scale. Because these habitat models remove unsuitable areas within the range of the species, the patterns of richness presented here are different from the coarse-resolution species’ habitat distribution models commonly presented in the literature. These maps provide a new, more spatially refined richness map. In addition, since these models are logically linked to mapped data layers that constitute habitat suitability, this suite of data can provide an intuitive data system for further exploration of biodiversity and implications for change at ecosystem and landscape scales”.
Some major limitations of this data come from the fact that USGS modelled species richness from habitat predictions of the GAP dataset which is based off 2001 CONUS data. This is a major drawback in the sense that species and biodiversity evolves every year and should be closely monitored in the context of rapid climate change. However, it remains the most updated nationwide dataset estimating species richness for the coterminous US, which calls for more governmental efforts to provide up-to-date data for land management purposes. Nonetheless, this data can provide a baseline to measure the evolution of species richness on tribal lands and the impact of tribal, state, and national policies which impact biodiversity and species richness.
Suitable uses of the data:
We have updated our terminology from “raw data” to “source data” to better reflect the contextual nature and origins of the information we provide. This change acknowledges that all data is influenced by the context in which it is collected, and aims to promote a more inclusive and accurate understanding of the information presented.