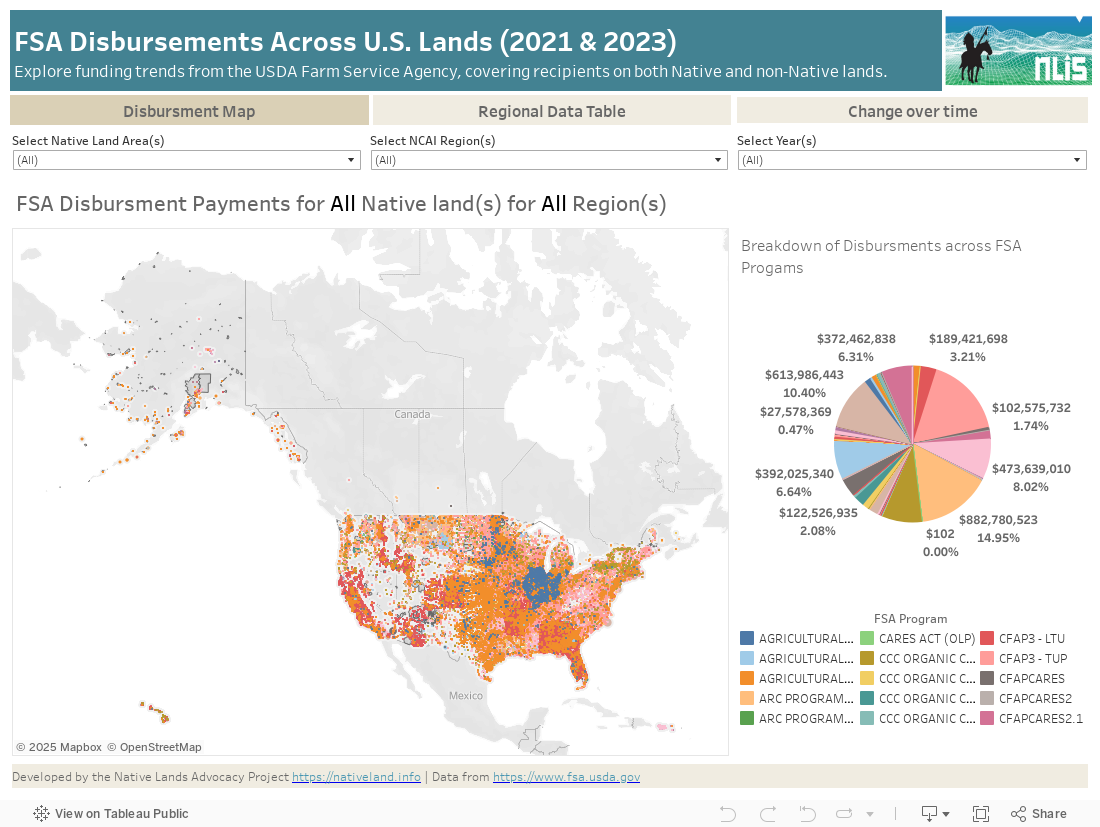
This interactive dashboard provides a detailed analysis of USDA Farm Service Agency (FSA) program disbursements for 2021 and 2023, offering insights into federal spending on agricultural programs across the United States. The dashboard includes data for all FSA program recipients, providing a comprehensive view of how funds were allocated during these years and how disbursements have changed over time.
Features of the Dashboard:
This dashboard empowers policymakers, agricultural producers, and stakeholders with accessible and transparent insights into federal agricultural spending. By understanding how funds are distributed across programs, regions, and time, users can identify funding trends, assess program impacts, and support data-driven decision-making. It also serves as a resource for improving access to financial programs and fostering equitable resource distribution.
Explore the dashboard to gain insights into how FSA programs contribute to supporting agricultural sustainability and resilience nationwide.
This dashboard is built using data from the USDA Farm Service Agency (FSA) on federal program disbursements for agricultural support in 2021 and 2023. The dataset includes detailed information on financial allocations across various FSA programs, such as disaster assistance, conservation initiatives, and agricultural loans. This comprehensive dataset captures disbursement amounts, program-specific details, and year-over-year changes, enabling users to analyze federal spending patterns across tribal lands and regions.
The geographic boundaries visualized in the dashboard are based on data from TIGER/Line Shapefiles, which accurately represent tribal lands as well as regional groupings based on the National Congress of American Indians (NCAI) regions. This ensures that disbursement data is contextualized specifically for tribal geographies, allowing users to explore program funding trends and impacts within Native communities.
For more information about the specific FSA programs included in this dashboard, please visit the USDA Farm Service Agency website at https://www.fsa.usda.gov/resources/programs.
By offering visualization options such as grouping by NCAI regions or specific tribal lands, a comparison graph of changes between 2021 and 2023, program-specific breakdowns, and raw data tables, the dashboard provides users with a powerful tool to analyze and understand FSA program disbursements. This data is vital for tribal leaders, policymakers, and agricultural stakeholders to evaluate program impacts, identify funding trends, and support climate-smart agricultural decision-making.
Explore the dashboard to gain insights into how federal agricultural funding supports sustainability, resilience, and development across Native lands and regions.
Understanding how federal funding is distributed through USDA Farm Service Agency (FSA) programs is critical for supporting Native agriculture and fostering economic resilience. This dashboard provides essential insights into FSA program disbursements across tribal lands and NCAI regions for 2021 and 2023, offering a valuable resource for tribes to evaluate federal investments in their communities.
Access to this data empowers tribal leaders, agricultural producers, and policymakers to identify funding trends and gaps, enabling them to make informed decisions about land use, agricultural development, and resource management. By visualizing disbursement patterns, users can better understand how federal funding supports essential agricultural programs such as disaster relief, conservation, and farm loans. These insights are instrumental in advocating for equitable resource distribution and securing additional funding for climate-smart and sustainable agricultural practices.
This dashboard is particularly important for addressing the historical challenges Native farmers and ranchers face in accessing credit and federal support. By providing a clear view of FSA program participation and disbursement amounts, it enables tribes to assess program impacts, plan for future funding opportunities, and support their communities in achieving greater agricultural sovereignty and sustainability.
The ability to group data by NCAI regions or specific tribal lands ensures that the information is contextualized to Native geographies, allowing for regional and local analyses. These insights can be used to inform grant applications, develop climate adaptation strategies, and support long-term agricultural planning efforts.
As tribes continue to navigate the challenges of climate change, economic development, and food sovereignty, this dashboard offers a vital tool for understanding and leveraging federal agricultural resources. By equipping users with accessible and actionable data, it helps strengthen the resilience of Native communities and their agricultural systems.
While this dashboard provides valuable insights into FSA program disbursements across Native lands and NCAI regions, there are several limitations and considerations to keep in mind:
Geographic Aggregation: The data in this dashboard is grouped by tribal lands and NCAI regions, which provides a broad overview of funding patterns. However, it does not include county-level information or allow for analysis of disbursements at smaller geographic scales. Users seeking highly localized data may need to consult additional sources.
Data Scope: The dashboard reflects FSA program disbursements for the year 2021. While it offers a snapshot of federal spending during that period, users should consider that program allocations and priorities may vary in subsequent years. Historical comparisons or trend analysis would require data from additional years, which we hope to add soon.
Program-Specific Details: The dashboard provides aggregated disbursement data for individual FSA programs but does not include granular details about the specific activities or projects funded. Users aiming to analyze program impacts in detail may need to cross-reference other datasets or reports.
Data Accuracy and Source Limitations: The data is sourced from the USDA Farm Service Agency and assumes accuracy in the original collection and reporting. Discrepancies or gaps in the raw data, such as unreported disbursements or missing tribal affiliation information, may affect the overall completeness of the analysis.
Tribal and Non-Tribal Data Context: While the data represents all FSA recipients within the defined regions, it does not distinguish between tribally affiliated and non-tribally affiliated participants within the aggregate totals. Users should interpret results with this context in mind.
External Factors: Disbursement amounts and patterns are influenced by various external factors, including federal funding availability, regional climate events, and program eligibility changes. These factors may not be fully captured in the dashboard but can significantly affect disbursement trends.
By acknowledging these limitations and considering them when interpreting the data, users can better understand federal spending patterns and their implications for agricultural development, resource allocation, and policy-making across Native lands.
We have updated our terminology from “raw data” to “source data” to better reflect the contextual nature and origins of the information we provide. This change acknowledges that all data is influenced by the context in which it is collected, and aims to promote a more inclusive and accurate understanding of the information presented.