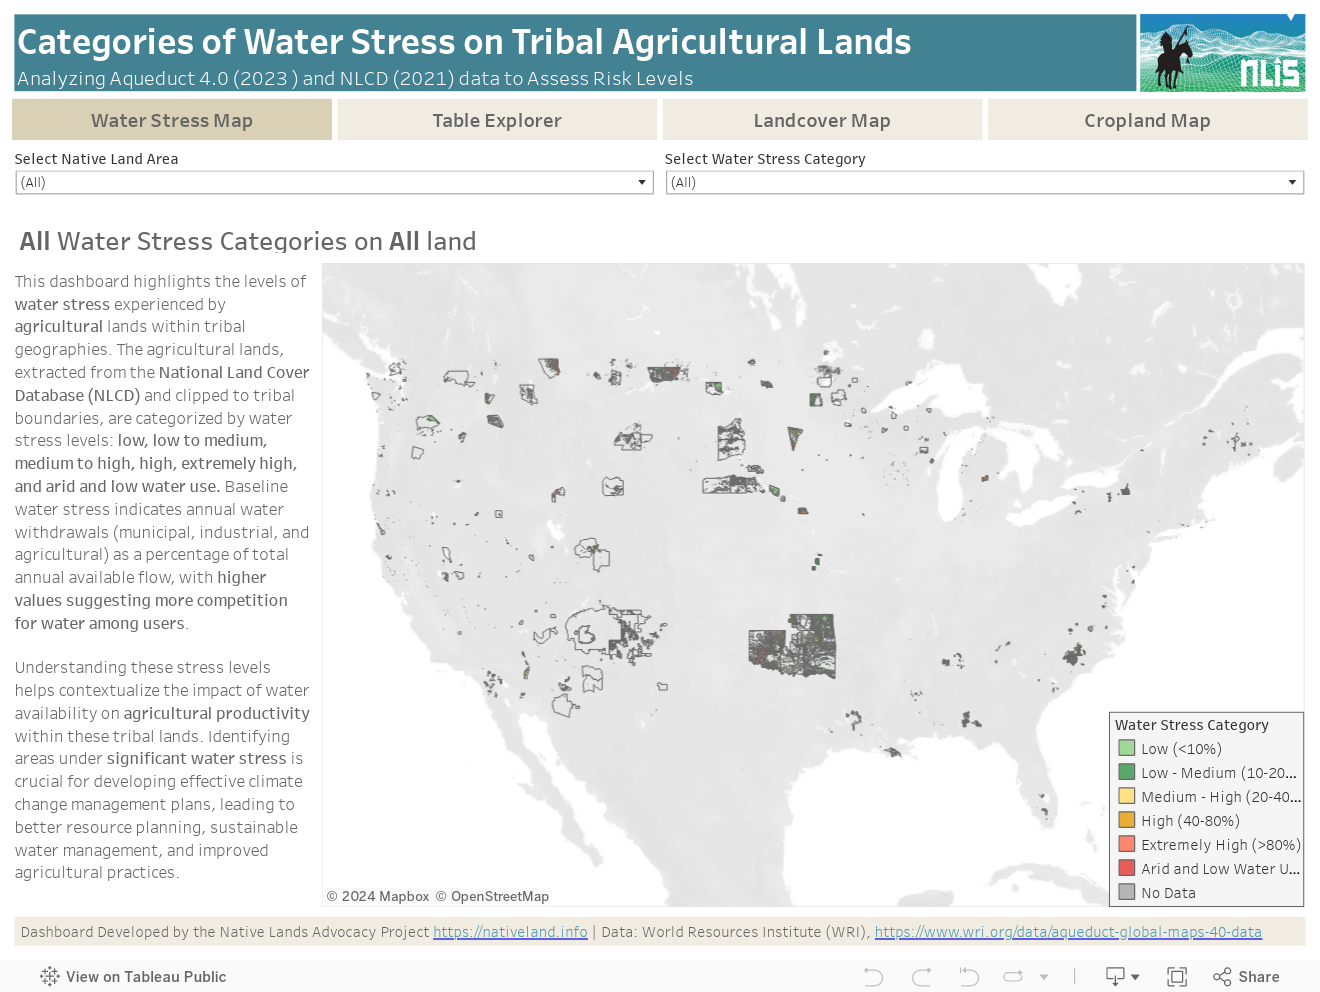
This data dashboard summarizes data from the World Resources Institute, and the National Land Cover Database for Native Lands in the United States. It highlights the distribution and impact of water stress on agricultural lands within Native boundaries. The dashboard features detailed maps and interactive elements, allowing users to explore different water stress levels affecting agricultural land. By providing these insights, the dashboard aims to support better resource management and planning for Native communities, offering a valuable tool to understand and address the challenges related to water scarcity and land use.
This dashboard includes data from the USGS’s National Land Cover Database (NLCD) and the Aqueduct 4.0 water risk framework from the World Resources Institute (WRI).
The National Land Cover Database (NLCD) provides nationwide data on land cover and land cover change at a 30-meter resolution, with a 16-class legend based on a modified Anderson Level II classification system. It is designed to provide cyclical updates of land cover and associated changes across the United States. The database allows for the analysis of both current and historical land cover and enables monitoring and trend assessments. NLCD products are widely used in fields such as biology, climate studies, education, land management, hydrology, environmental planning, risk and disease analysis, telecommunications, and visualization.
The NLCD is developed by the Multi-Resolution Land Characteristics (MRLC) consortium, a group of federal agencies that coordinate and generate consistent and relevant land cover information at a national scale. This consortium has mapped the contiguous United States, Hawaii, Alaska, and Puerto Rico into a comprehensive land cover product using decadal Landsat satellite imagery and other supplementary datasets.
The Aqueduct 4.0 water risk framework from the World Resources Institute (WRI) assesses water-related risks, including water stress, across the globe. Aqueduct 4.0 provides data on baseline water stress, which refers to the ratio of annual water withdrawals to available renewable surface and groundwater supplies. The framework helps users identify areas of high water stress and supports better planning and management of water resources, especially in the context of climate change and increased competition for water.
Boundary data used to define summary areas was obtained from the TIGER/Line Shapefile, 2022, Nation, U.S., American Indian/Alaska Native/Native Hawaiian Areas (AIANNH). This shapefile includes federally recognized American Indian reservations and off-reservation trust land areas, state-recognized American Indian reservations, Hawaiian home lands (HHLs), Alaska Native village statistical areas (ANVSAs), Oklahoma tribal statistical areas (OTSAs), tribal designated statistical areas (TDSAs), and state designated tribal statistical areas (SDTSAs). We filtered out features that did not overlap with the two agricultural land cover categories from the NLCD to focus on relevant areas, ensuring accurate representation of Native lands for the analysis.
Understanding water stress is crucial for promoting climate-smart agriculture on Native lands. Water is a vital resource for managing Native lands, and knowing the levels of water stress helps in making informed land use decisions. This dashboard provides essential insights into the distribution and impact of water stress on agricultural lands within Native boundaries. By visualizing water stress categories, tribes can better plan and allocate resources to ensure sustainable agricultural practices.
The data displayed on this dashboard allows tribes to see which areas are experiencing different levels of water stress, from low to extremely high. This understanding is essential for developing effective water management strategies and ensuring that agricultural activities can be sustained even in areas with high competition for water resources. Additionally, knowing the extent of agricultural lands within each Native boundary provides a broad perspective on the agricultural capacity and needs of Native communities.
By integrating data from the World Resources Institute’s Aqueduct 4.0 water risk framework and the National Land Cover Database (NLCD), this dashboard offers a comprehensive view of land cover and water stress. The NLCD provides detailed land cover information, helping to identify areas of cropland and other land cover types, while the Aqueduct 4.0 data highlights water stress levels. This combination of data is instrumental in promoting better planning and management of water resources on Native lands.
With climate change posing increasing challenges to water availability, this dashboard serves as a valuable tool for tribes to develop climate-smart agricultural practices. By understanding current water stress categories, tribes can implement strategies to mitigate the impact of water scarcity, enhance resilience to climate change, and ensure the long-term sustainability of their agricultural activities. This dashboard supports the goal of promoting climate-smart agriculture on Native lands, helping to secure the future of Native communities and their resources. For more detailed land cover information, visit our existing dashboard covering the NLCD dataset.
While this dashboard provides valuable insights into water stress and land cover on Native lands, there are several limitations and considerations to keep in mind:
Resolution of Data: The National Land Cover Database (NLCD) data is provided at a 30-meter resolution, and the cropland data is at a 10 km resolution. While these resolutions are suitable for broad analysis, they may not capture fine-scale variations within smaller areas or specific land parcels.
Temporal Coverage: The water stress data from the Aqueduct 4.0 framework and the land cover data from NLCD cover different time periods. Users should consider the temporal alignment when analyzing the data. Additionally, the NLCD updates are cyclical, which might not capture rapid land cover changes occurring between updates.
Data Integration: Combining datasets from different sources, such as the NLCD and Aqueduct 4.0, may introduce inconsistencies due to differences in data collection methodologies, classification systems, and temporal resolutions. Care should be taken when interpreting integrated data.
Boundary Definitions: The boundary data for Native lands comes from the TIGER/Line Shapefile, 2022. This dataset includes various types of Native areas, but there might be discrepancies or updates in boundary definitions that are not reflected in this dataset. Moreover, the boundaries do not differentiate between fee and trust lands, which might affect the analysis.
Water Stress Metrics: The baseline water stress metric from Aqueduct 4.0 is calculated using water withdrawals and available renewable water supplies. This metric may not fully capture localized water stress conditions or account for future changes in water availability due to climate change or other factors.
Agricultural Land Categorization: The agricultural land categories used in the NLCD data (Pasture/Hay and Cultivated Crops) provide a general overview of agricultural lands but might not capture all types of agricultural activities or specific crops grown within Native lands.
Climate Change Impacts: While the dashboard provides insights into current water stress levels, it does not include projections of future water stress under different climate change scenarios. Users should consider external climate models and projections for a comprehensive understanding of future water stress.
By considering these limitations and contextualizing the data within these constraints, users can make more informed decisions and interpretations regarding water stress and land cover on Native lands.
We have updated our terminology from “raw data” to “source data” to better reflect the contextual nature and origins of the information we provide. This change acknowledges that all data is influenced by the context in which it is collected, and aims to promote a more inclusive and accurate understanding of the information presented.