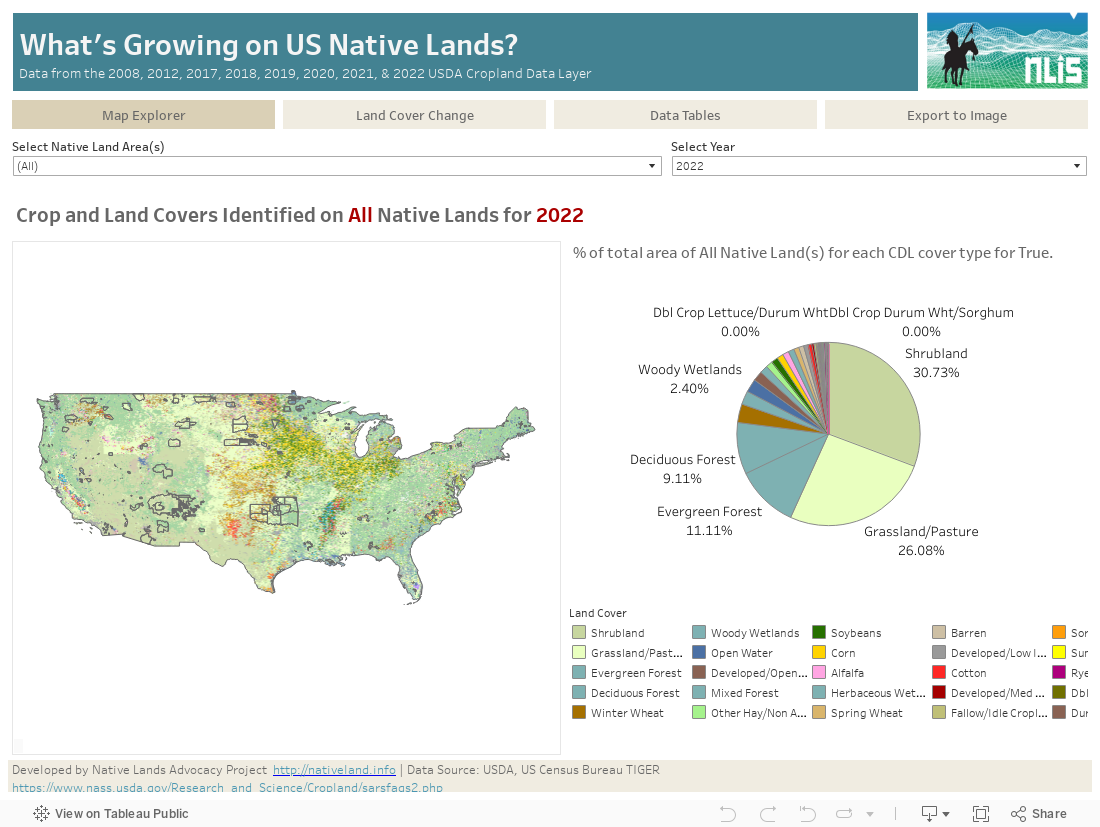
This data dashboard summarizes data from the USDA Cropland Data Layer for 552 unique native land areas in the coterminous United States for the years 2008, 2012, 2017, 2018, 2019, 2020, 2021 & 2022 and can be filtered for one or more native land area.
According to the the USDA, the Cropland Data Layer is a “raster, geo-referenced, crop-specific land cover data layer created annually for the continental United States. The CDL is created using moderate resolution satellite imagery and extensive agricultural ground truthing. The purpose of the Cropland Data Layer program is to use satellite imagery to provide acreage estimates to the Agricultural Statistics Board for major commodities and to produce digital, crop-specific, categorized geo-referenced output products.” The CDL data has been collected since 1997 making it an excellent tool for analyzing long-term land cover trends.
The data includes 130 categories ranging from specific types of crops, pasturelands, developed lands, wetlands, etc. According to Lark et al. (2017) “the CDL covers the conterminous 48 states with field-level resolution and crop classification accuracies typically upwards of 90% for major commodities like corn, cotton, rice, soybeans, and wheat.” The Cropland Data Layer has been used in hundreds of studies on a range of topics from agriculture productivity, crop variability, impacts of climate change, climate resiliency studies, estimates of carrying capacity, etc.
Boundary data used to define summary areas was obtained from the 2019 US Census Bureau’s TIGER/Line Shapefile for American Indian areas in the United States which includes both American Indians and Alaskan Natives, a total of 845 unique features or land areas. From this we removed all features/areas outside of the conterminous United States leaving a total of 549 features/areas.
There is an extreme lack of data to understand the breadth and extent of agriculture on Native Lands in the United States. Most of the agriculture data collected by the United States Government is aggregated at the State and County levels and because native lands often overlap state and county boundaries, it makes it extremely difficult to get accurate totals for just native lands. Starting in 2002, the USDA began collecting agriculture data for a limited number of American Indian Reservations, only 75 in the most recent 2017 census. While this provided invaluable data, the data is self-report by individual producers and thus it is likely incomplete. The Cropland Data Layer on the other hand is based on remote telemetry (satellite data) vs. self reported data, and thus is not subject to a non-response bias. For that same reason, this is the only source of data on crop cover for Native Lands that allows for nationwide comparisons.
Limitations
This dashboard aggregates data using the external boundaries of native lands and tribal statistical areas and does not differentiate between fee and trust lands within those boundaries.