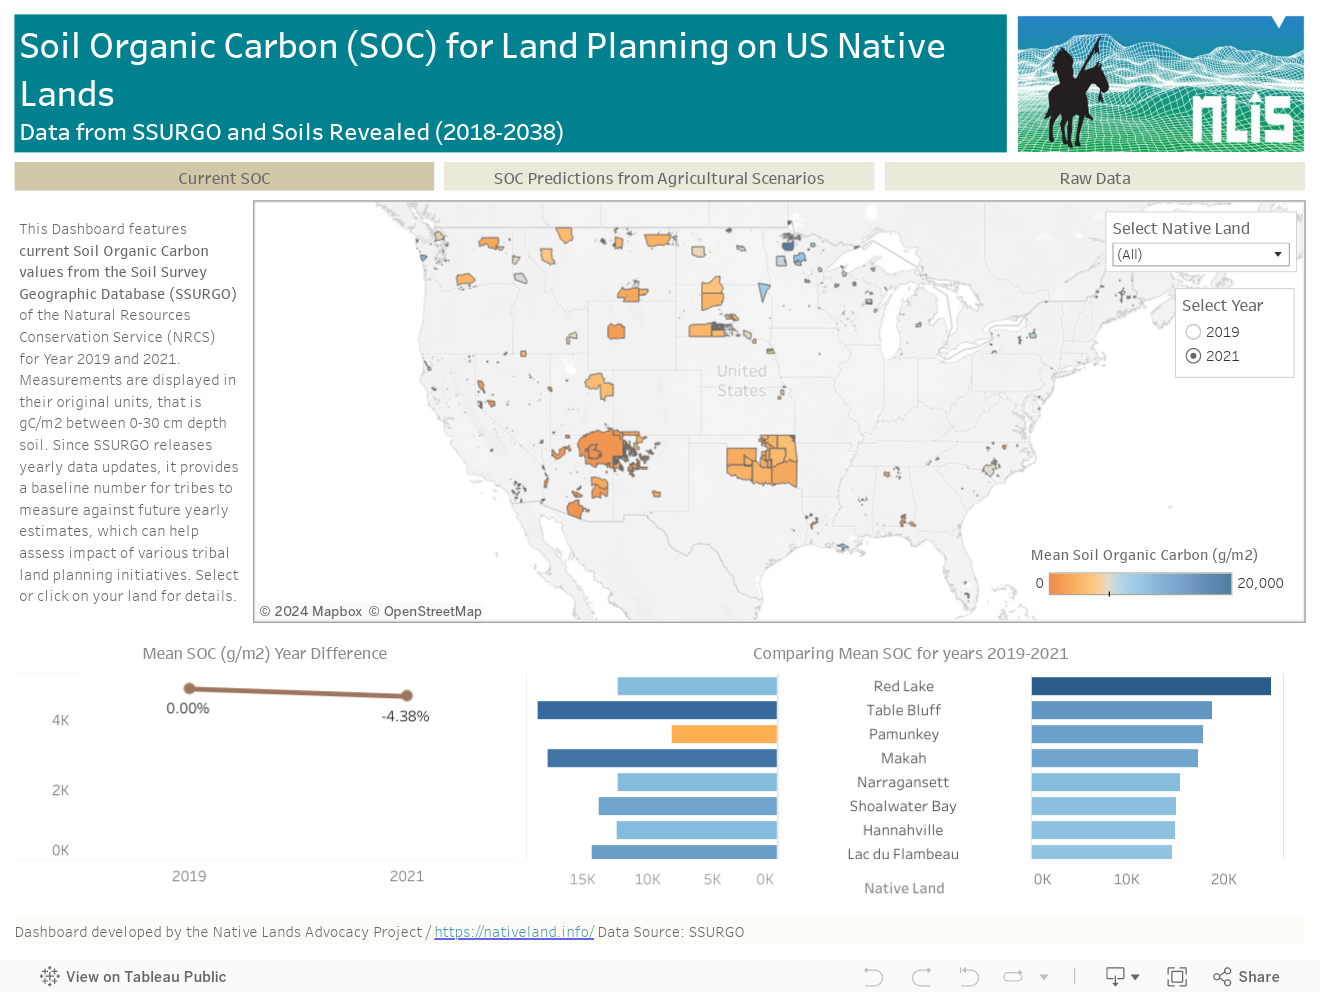
This data dashboard summarizes past and present Soil Organic Carbon (SOC) data for all Native Lands but also future estimates depending on different agricultural scenarios. Data comes from the Soils Survey Geographic Database (SSURGO) for past and most to date available values (2019 and 2021). For future scenarios, we used estimates from the Soils Revealed Project, which predicts SOC based on different agricultural and land planning scenarios applied over a 20 year period (2018-2038). This dashboard can be used as a baseline to monitor SOC on reservations based on different tribal land policies, and can provide guidelines on to which land planning seems most effective for carbon sequestration on each tribe.
Data comes from the Soils Survey Geographic Database (SSURGO) for past and most to date available values (2019 and 2021). For future scenarios, we used estimates from the Soils Revealed Project, which predicts SOC based on different agricultural and land planning scenarios applied over a 20 year period (2018-2038). This dashboard can be used as a baseline to monitor SOC on reservations based on different tribal land policies, and can provide guidelines on to which land planning seems most effective for carbon sequestration on each tribe.
We applied tribal boundaries data to these datasets to obtain SOC means and create this Tableau Dashboard. Boundary data used to define summary areas was obtained from the 2019 US Census Bureau’s TIGER/Line Shapefile for American Indian areas in the United States which includes both American Indians and Alaskan Natives, a total of 845 unique features or land areas. From this we show the geographies that yield non-null results, i.e 373 unique features/areas for the Present and past SOC view from the SSURGO data and 703 unique features/areas for the Soils Revealed Project Data for future estimates based on land planning scenarios.
As tribes continue to steward their lands and resources, there is a growing focus on climate mitigation and planning. Carbon stocks and sequestration is a key part of that conversation, but data remains too sparse, not applicable for planning and sensitive due to the long history of data extraction and colonialism. Our dashboard uses already existing published estimates to provide summary data for carbon planning and to support the carbon conversation for tribes. The dashboard does not release any detailed or private information, or information about specific sites within tribes. It only provides baseline numbers to inform land planning. Additionally, the feature of the Soils Revealed Data applied to Native Lands uniquely shows how a specific type of land-use might overall affect specific tribal geographies over 20 years (2018-2038), which can help inform tribes’ and individual land stewards’ decision-making.
This dashboard visualizes data and analyses completed for a collective project led by a coalition of Native scholars and allies, which is featured in a policy paper that will be published in Issues In Development (more details soon).
Please send us your feedback and comments.