This data includes the USGS’s National Hydrography Plus Dataset V2 (NHDPlus), released in 2012, and the 2021 TIGER Boundaries for U.S. American Tribal lands as of January 1st, 2021, as reported by the federally recognized tribal governments through the Census Bureau’s Boundary and Annexation Survey (BAS). Overlapping features and associated data from the NHDv2 and the TIGER boundaries was obtained to summarize surface water resources on tribal lands, such as, streams, ditches, lakes, and reservoirs.
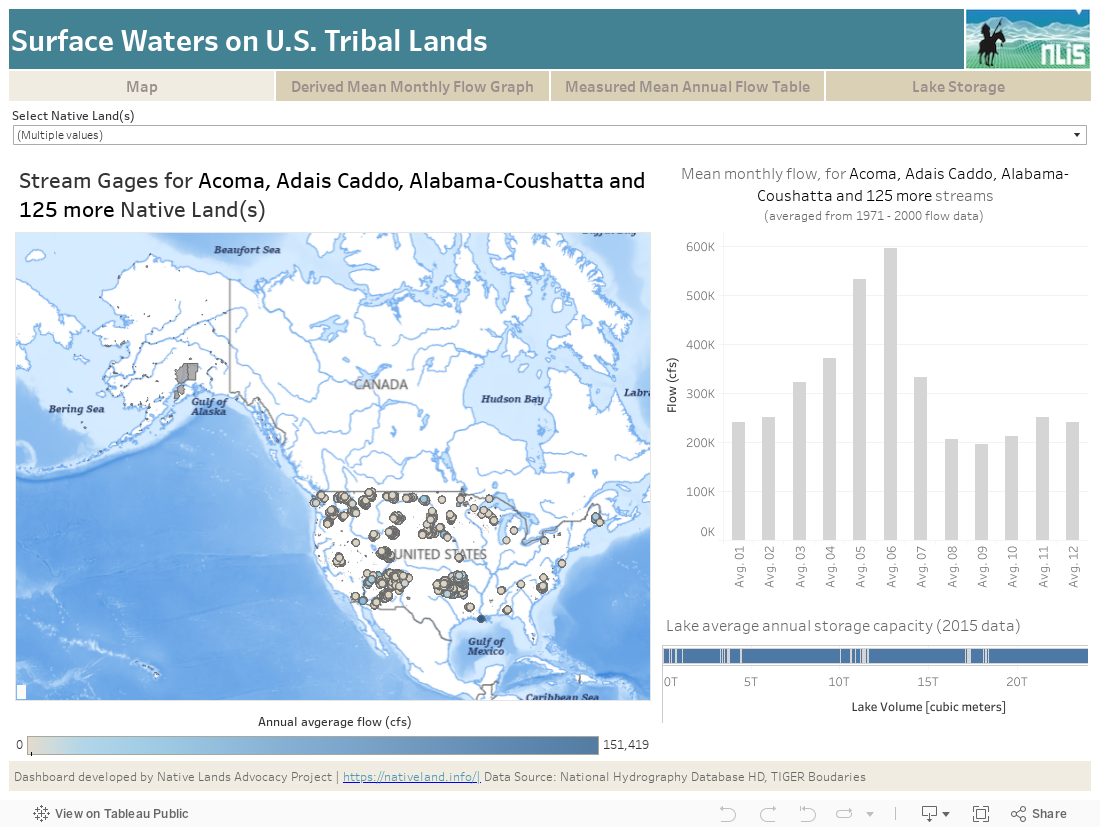
This dashboard includes data from the USGS’s National Hydrography Dataset Plus v2. Included in the this data is stream gage flows, as well as network-interpolated stream flows for ungaged portions of waters on Native Lands. Additionally, water quantity for storage in lakes and other impoundments is included as well.
NHDPlus is an integrated water data tool that utilizes features of the National Hydrography Dataset (NHD), the National Elevation Dataset
(NED), and the National Watershed Boundary Dataset (WBD). NHDPlus, based on the medium resolution NHD (1:100,000-scale). NHDPlus is built from static copies of the medium resolution (1:100,000-scale or better) NHD1, 30 meter NED1, and the WBD. These three datasets are regularly updated. Therefore the snapshots of NHD, NED and WBD that are used to construct NHDPlus are included with the NHDPlus data.
Boundary data used to define summary areas was obtained from the 2021 US Census Bureau’s TIGER/Line Shapefile for American Indian areas in the United States which includes both American Indians and Alaskan Natives, a total of 845 unique features or land areas. From this we removed all features/areas that did not overlap with the existing NHDPlus data. Included in our data after considering the overlapping datasets, there are 143 Native Lands that have USGS stream gages recording flows – the range for this data set is from 1889 to 2010, there are 134 Tribal Lands with Lake features identified.
Water is an essential resource for the management of tribal lands and is a key consideration for land management planning. Without inventorying the water resources available on tribal lands, it will not be possible to make appropriate land use decisions. Water resources include both surface water and groundwater. Adequate water supplies are necessary for land management considerations, but also the quality of water is necessary to provide safe drinking water, safe habitat, for safe recreational use, and to maintain healthy plant communities. Using the data displayed on this dashboard, tribes and tribal members can identify the stream gauge IDs and associated information from these gauges for mean monthly flows (averaged over the period of 1971 to 2000), as well as mean annual flows, where data spans from 1889 to 2010 for some tribal lands. This dashboard shows the trends in water quantity, giving a historical record of water quantity on tribal lands. The identified stream gauge IDs for native lands can be further used to see real-time data from the USGS’s National Water Information System.
The major limitation of this data is that it does not include stream gauge records for all Native Lands – meaning data are absent for the status of un-gaged water resources. Additionally, there is a lack of data at the national level that show water diversions. This data should be used to summarize historical accounts of water on tribal lands. The stream gauge IDs should be utilized to capture real-time data and current-year trends in data to compare to historical accounting. Though this data does summarize water availability, it does not show a Native nation’s water rights – which determines what water is available as a means of what water nations are guaranteed to be able to use. As the climate changes, so will patterns of water flow and form; though this data does not capture these real-time changes, this dashboard provides a historical comparison to deepen our understanding of how patterns in our water are changing.