Energy Access Viewer
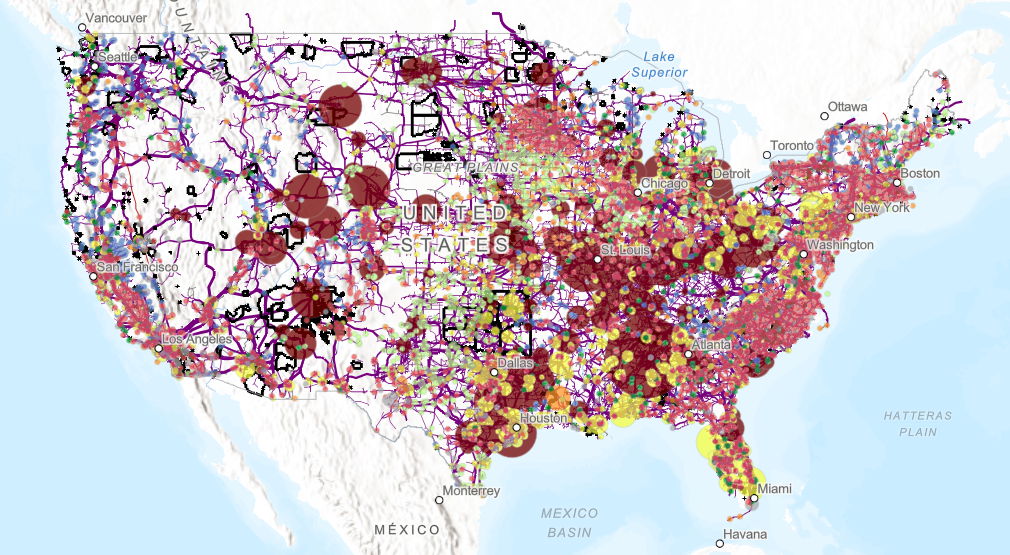
Explore detailed data on power plant emissions, energy generation, and infrastructure with our interactive dashboard. Specifically designed for US Native Lands, it provides insights into environmental impacts and energy dynamics in these regions.
Culvert Condition Viewer
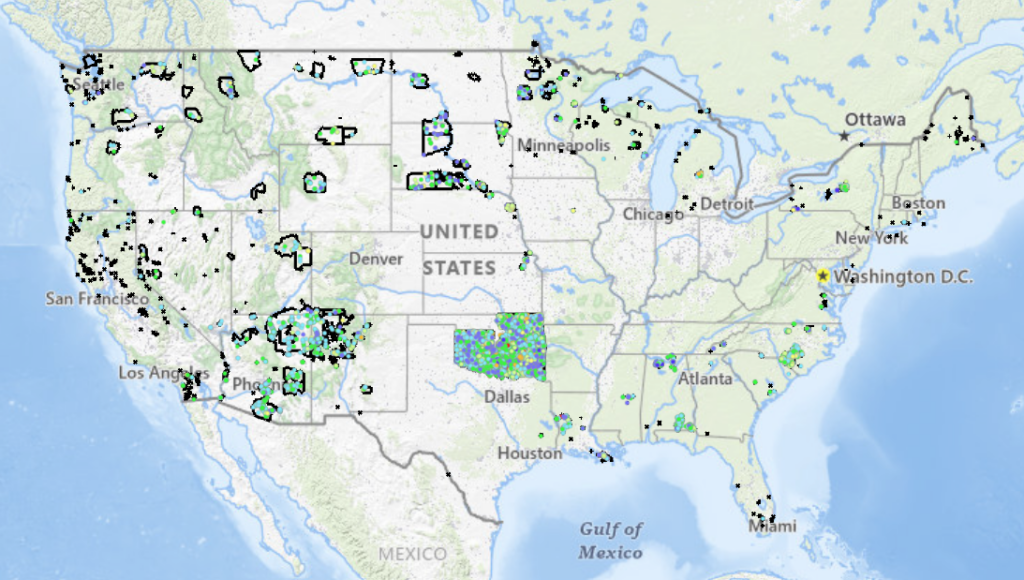
Explore Tribal Lands in the lower 48 states with this interactive map, showcasing culvert conditions and National Bridge Inventory (NBI) ratings to support environmental analysis and decision-making.
Creating a Historic Loss Assessment, Part 1: Native history and land dispossession

By calculating land dispossession, this report seeks to not only identify what has been taken from Native peoples but also how this theft became the original source of capital that built Colorado and the West.
Tree Canopy Coverage Viewer
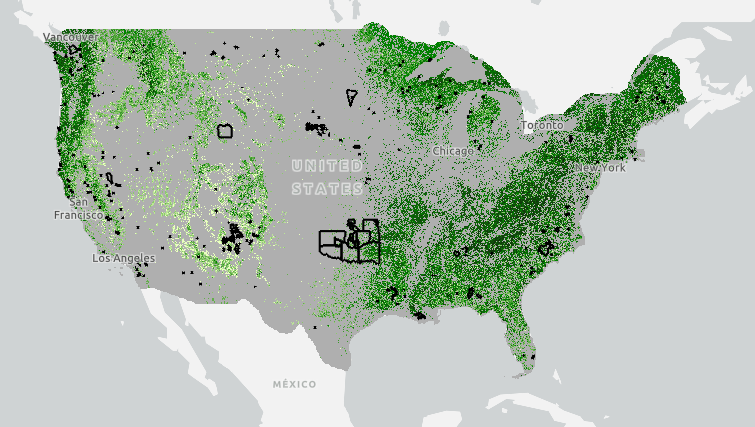
This viewer shows the canopy cover percentages in 2021 and changes in proportion of land surface covered by trees in the native lands across the United States.
Elevation Profile Explorer
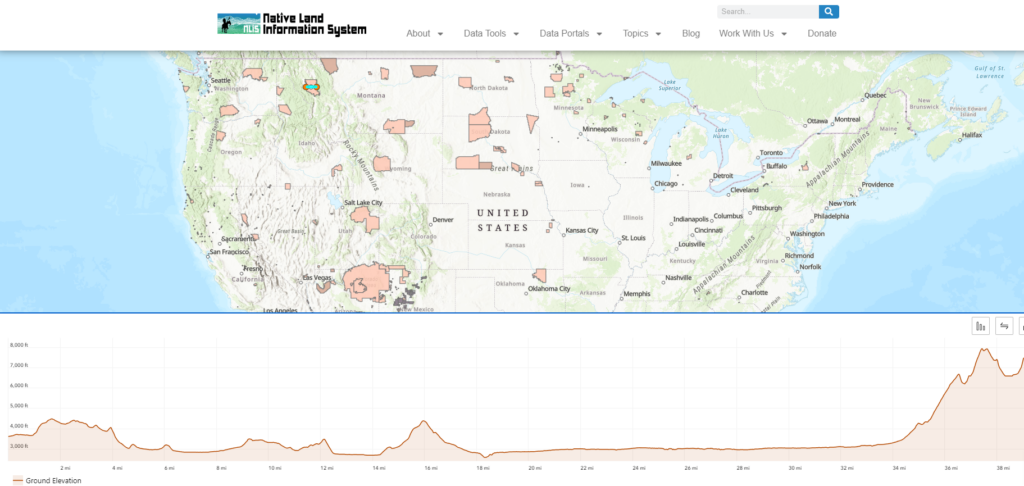
Welcome to the Elevation Profile Explorer, a powerful tool designed to help you understand the terrain and elevation changes across Native lands in the United States.
SSURGO Soil Classification Viewer for US Native Lands
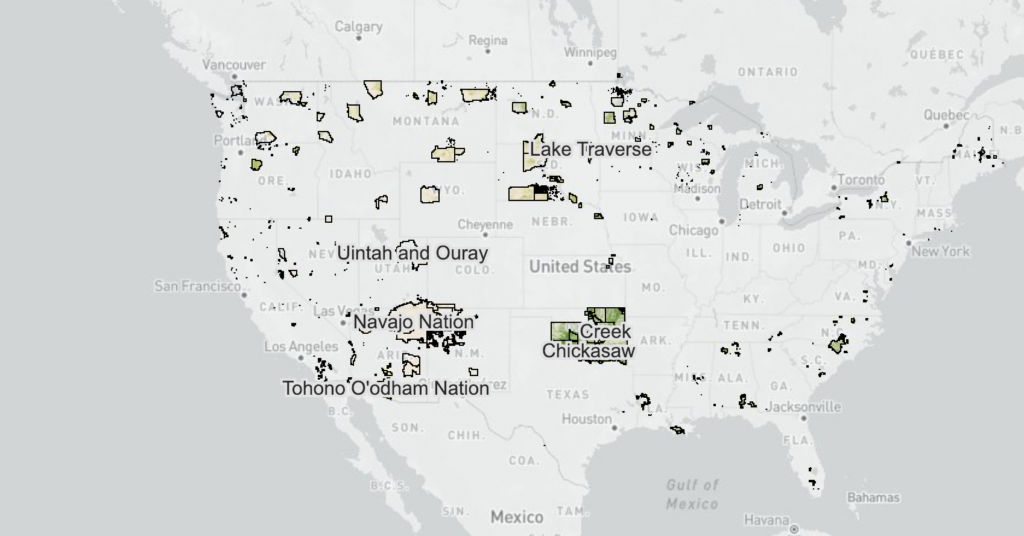
This map shows the canopy cover percentages and land cover types on Reservations and USFS lands.
Introducing the Historic Loss Assessment: Articulating lost lives, land, and resources for the Native Nations in your state
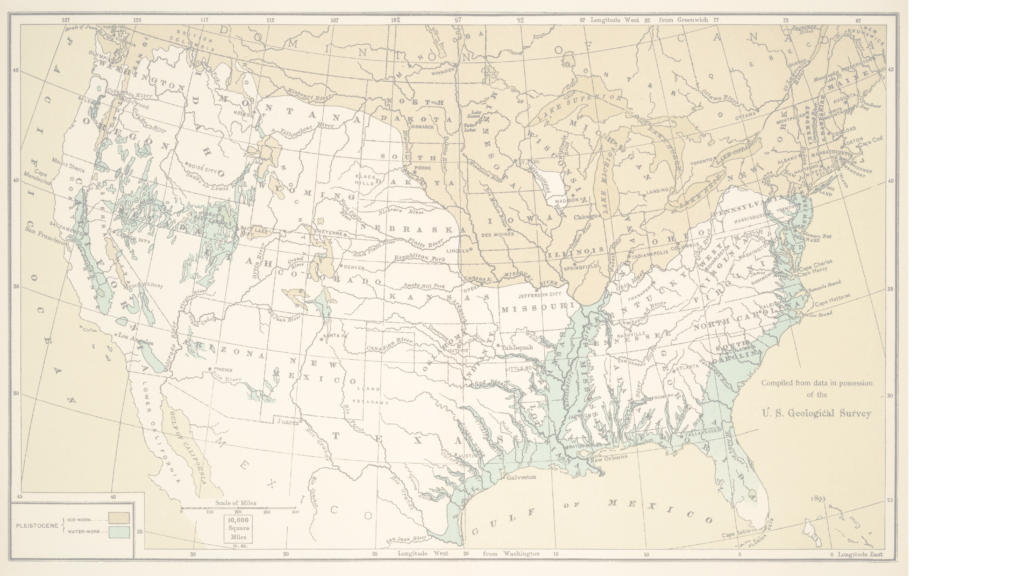
While much of settler colonialism’s harm to Native Nations is unquantifiable, assessments like this provide data that helps tell those Nation’s stories.
Soil Salinity in U.S. Native Lands
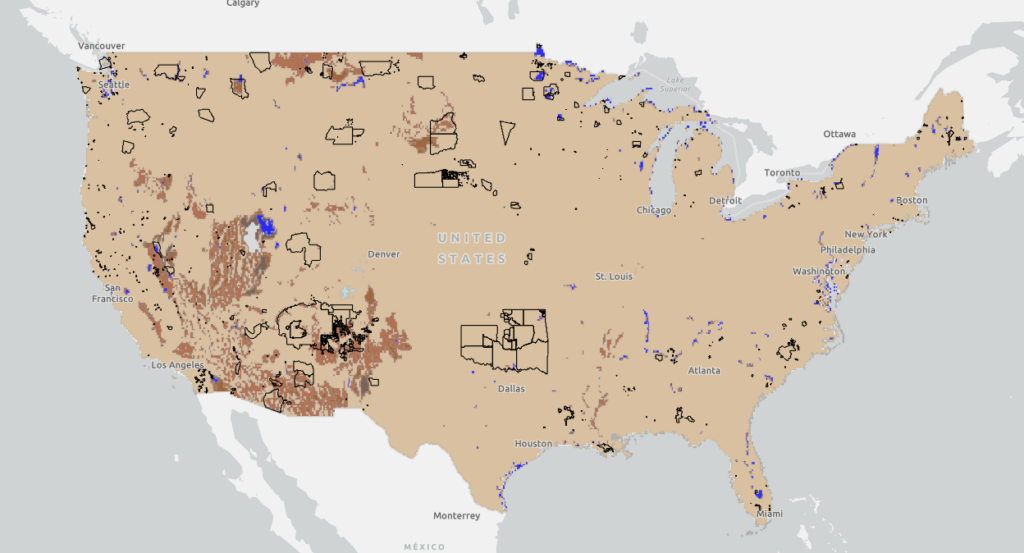
This map displays soil salinity data layers derived from the Harmonized World Soil Database (HWSD) Global Soil Quality – Constraints due to Excess Salts (HWSD Excess Salts). This Soil Salinity data on US Native Lands is presented here as a potential resource for Tribes to use in natural resource and climate adaptation assessment and planning.
Renewable Energy Production on US Native Lands
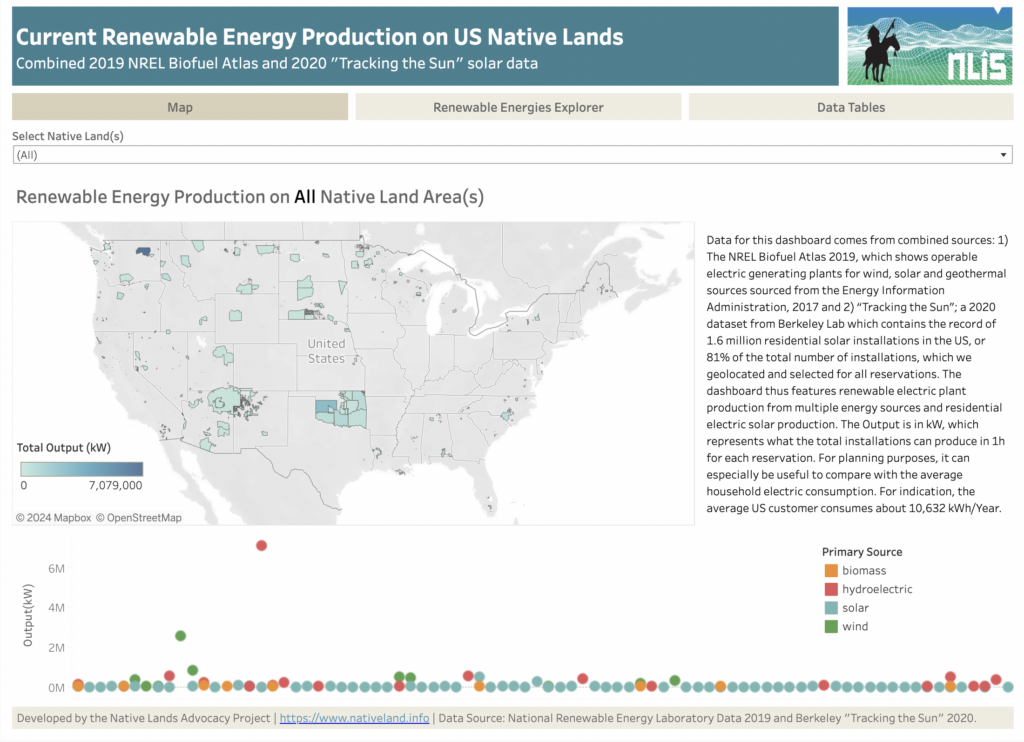
About this Dashboard This dashboard features current renewable energy production (wind, solar, biomass, and hydroelectric) on US Native Lands. It combines data from two sources: (1) the NREL Biofuel Atlas 2019, which shows operable electric generating plants for wind, solar, and geothermal sources sourced from the Energy Information Administration (2017), and (2) “Tracking the Sun,” a […]
Agricultural Water Stress on US Native Lands
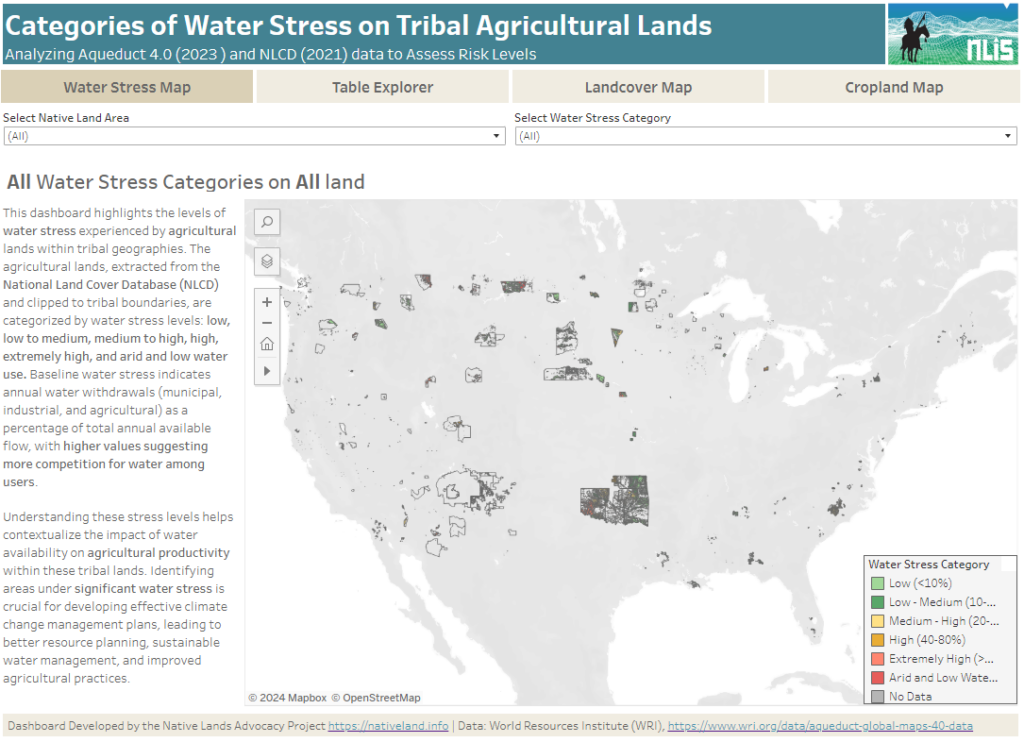
About this Dashboard This data dashboard summarizes data from the World Resources Institute, and the National Land Cover Database for Native Lands in the United States. It highlights the distribution and impact of water stress on agricultural lands within Native boundaries. The dashboard features detailed maps and interactive elements, allowing users to explore different water […]
Energy & Mineral Revenue From US Native Lands (2008-2020)
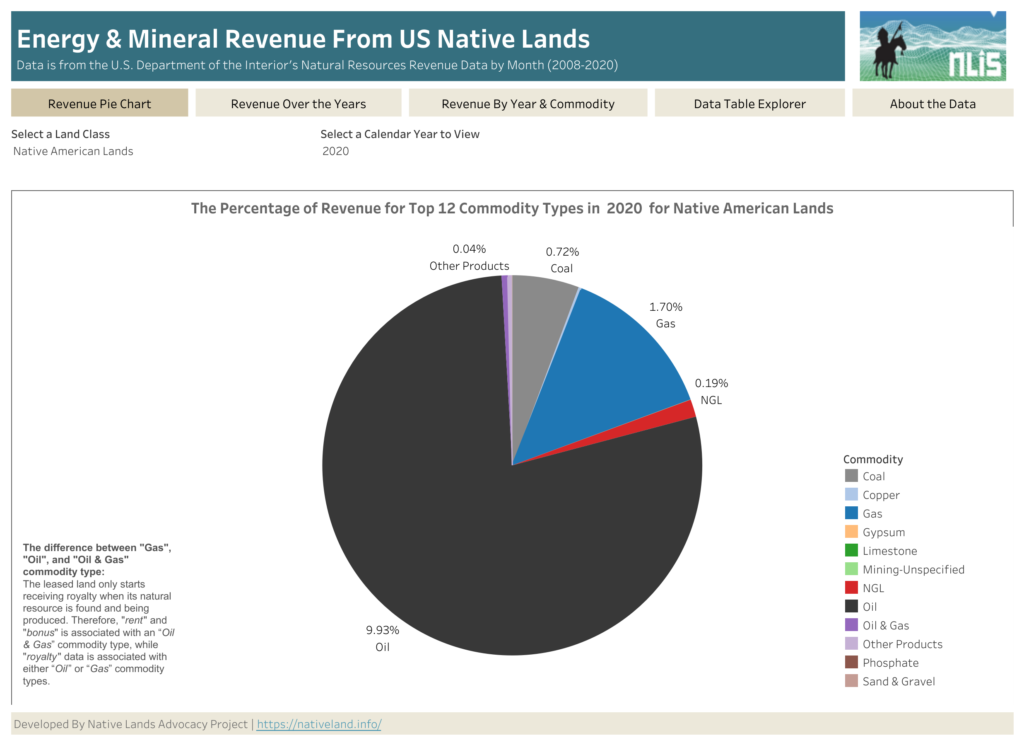
About this Dashboard This data dashboard, developed by the Native Lands Advocacy Project, summarizes data from the US Department of Interior’s Office of Natural Resources Revenue (ONRR) for US Native Lands for the period of 2008 through 2020. This dashboard also has the data for all federal lands. 0 Resource Types 0 Land Class 0 Years of […]
Assessing Food Resilience on Native Reservations: the Good Food Access Indicator

NLAP’s Good Food Access Indicator (GFAI) helps Native communities challenge those who look at Native food systems through a deficit lens by creating a new way to measure food access on the reservation.
