Our new Crop Diversity data dashboard is the first index of Cropland Diversity ever calculated and published for US Native Lands. What findings does this dashboard reveal? And why does this data matter?
What is Crop Diversity? Why is it significant?
Species biodiversity, which is understood as “all species of plants, animals and micro-organisms existing and interacting within an ecosystem (Vandermeer and Perfecto, 1999), is essential to the healthy functioning of earth’s ecosystems. Biodiversity is associated with many ecological services, such as prevention of soil erosion, regulation of hydrological processes, recycling of nutrients, minimization of undesired or invasive organisms, detoxification, and much more (Altieri, 1999).
Research on biodiversity has tended to focus on natural areas. However, in the contiguous United States, croplands comprise 22% of our land base and therefore have a major impact on our lands and ecosystems (Aguilar et al., 2015). A growing body of research seeks to explore the impact of these croplands on biodiversity.
“Biodiversity in agricultural systems is associated with critical ecosystem processes such as nutrient and water cycling, pest and disease regulation, and degradation of toxic compounds such as pesticides. Diverse agroecosystems are more resilient to highly variable weather resulting from climate change and often hold the greatest potential for sustaining important ecosystem services such as natural pest control."
Aguilar et al., 2015
While the importance of biodiversity in crop production is demonstrated, no data currently provides a nationwide picture of the situation for US Native lands. This dashboard aims at remedying this inequality in data access, along with providing tribes and land stewards useful information to inform sovereign and resilient crop planning.
The Crop Diversity Data Dashboard
Our data dashboard applies the Simpson Index of Diversity to the USDA’s Cropland Data Layer (CDL) to measure the diversity of crops on Native lands in the contiguous US. To read more about the CDL and the methodology involved in these calculations, see the dashboard’s landing page.
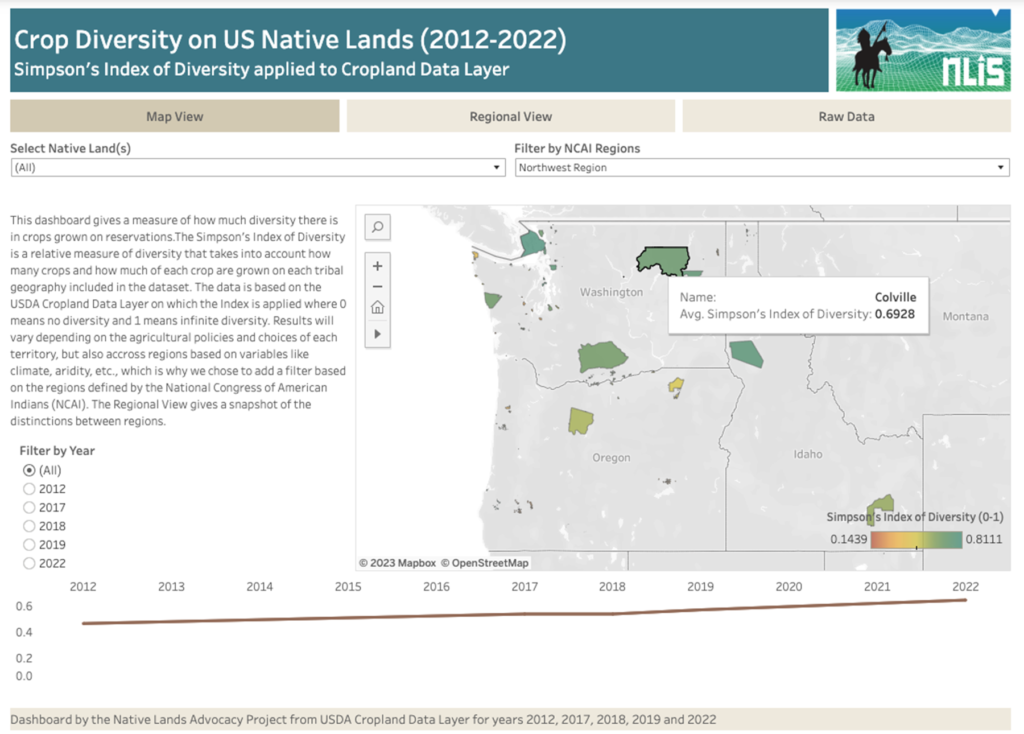
This dashboard indicates the measure of diversity by a scale of 0 – 1, where 0 indicates no diversity and 1 represents infinite diversity. The data is available for five distinct years: 2012, 2017, 2018, 2019, and 2022.
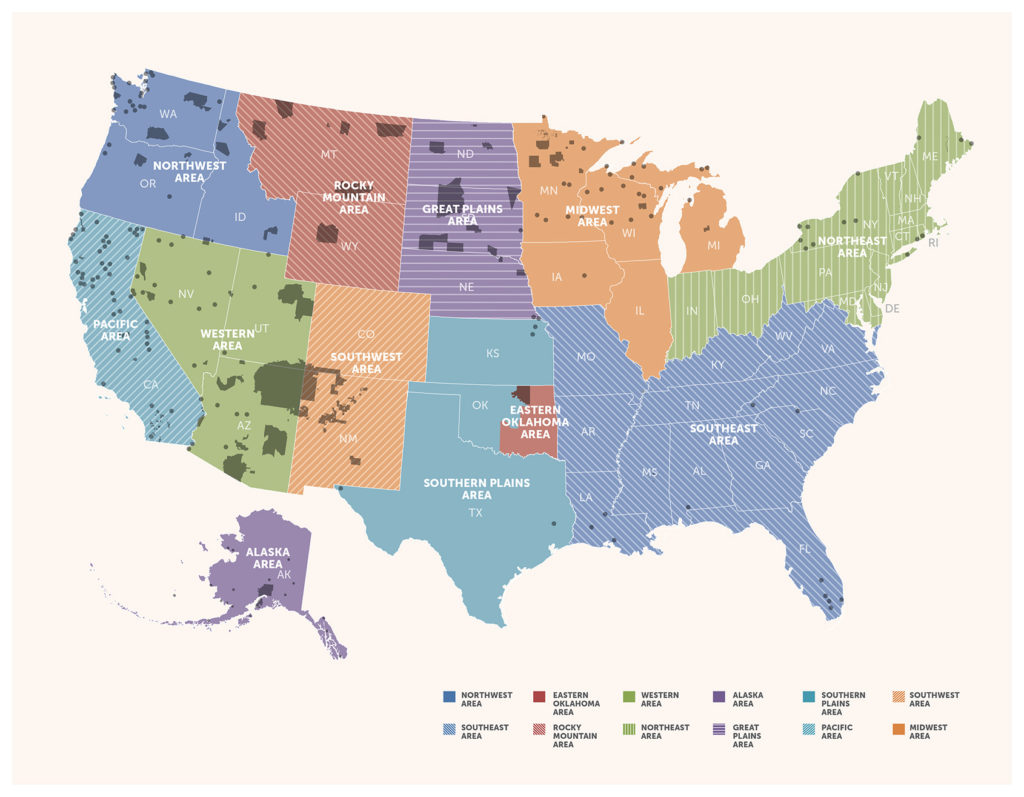
Our dashboard can be filtered by NCAI Region, which we’ve opted to use over other non-Native agricultural regions, as the NCAI has specifically taken tribal clustering into account in the creation of their regions.
Seen below, on the left, is the map view of the Northwest Region. The map provides a color-coded overview of cropland diversity on each tribal land. Cropland diversity trends since 2012 can be seen on the graph at the bottom of the dashboard.
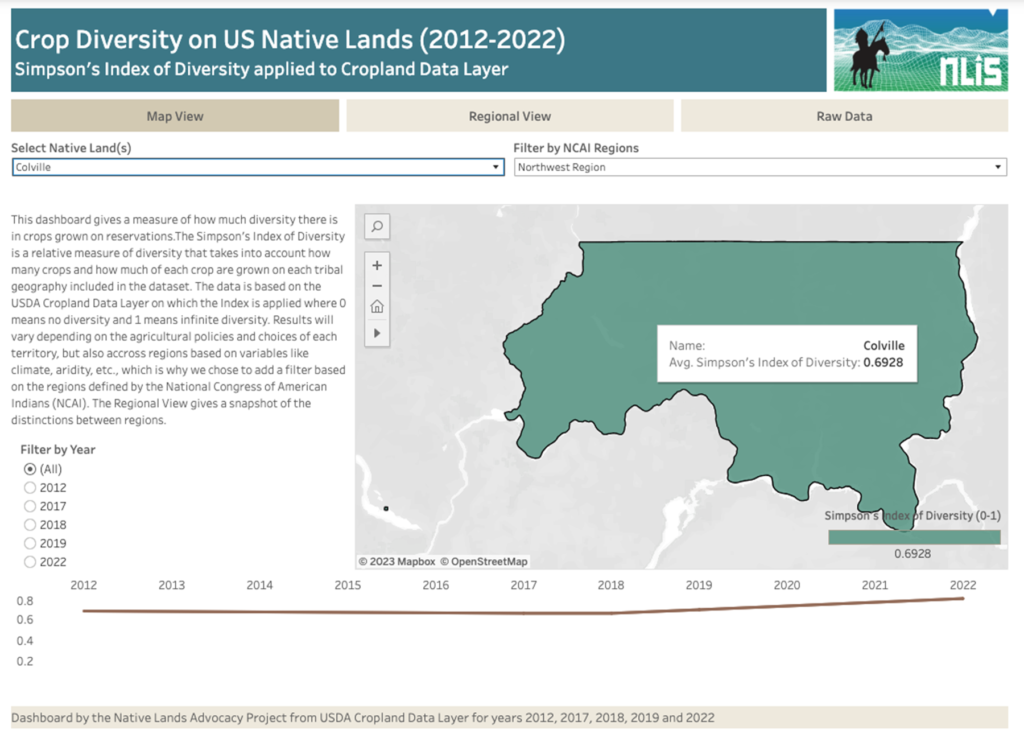
Information about individual tribal lands can be viewed by hovering over their land base, or by filtering specifically for that reservation. In the image on the right, the dashboard has been filtered specifically for the Colville Reservation. Click either image to view in more detail.
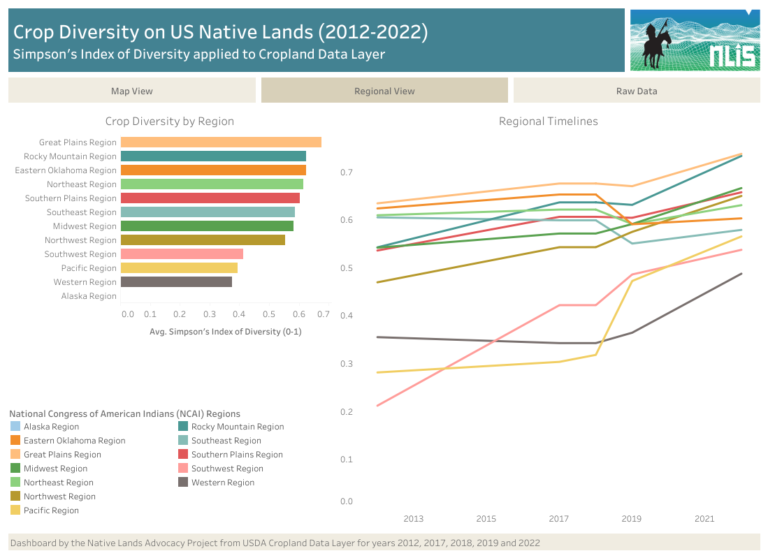
The second tab of our dashboard is a Regional View of the Cropland Diversity data. This tab provides an overview of each region’s cropland diversity, along with the trends since 2012. We can see that Cropland Diversity has been trending upwards in almost all of the NCAI regions since 2012—this is encouraging!
In fact, this dashboard shows an increase in crop diversity from 2012 to 2022 in Indian Country (from 0.46 to 0.59 overall). By contrast, the Aguilar et al. (2015) study showed a clear downward trend in crop diversity from 1978 to 2012 in the conterminous US. This data requires further analysis but seems to show that contrary to national trends, agriculture on Native lands is increasingly diverse.
While these findings require further analysis, the significance of this increase in crop diversity on Native lands (even while crop diversity decreases nationwide) cannot be overstated!
This data does not distinguish between Native and non-Native agricultural producers on Native lands (unlike, for example, our dashboard about the USDA Census of Agriculture), but we have reason to believe that it is, in fact, the practices of Native producers that have caused crop diversity to increase on Native lands.
We already know that Native producers use far fewer pesticides than non-Native producers, have more equal representation of female producers, and are far more likely to raise bison (a keystone Great Plains species that is far healthier for the land and climate than cattle). These practices exist even as Native producers receive far less agricultural revenue than non-Native producers on reservations.
These factors indicate that Native producers are operating within a different agricultural paradigm than many non-Native producers—a paradigm that is not exploitative and does not only consider maximum extraction of profit from the land, but instead prioritizes long-term stewardship of the land and all that lives on it.
In understanding this data, we can also look to the long history of indigenous food practices that rely upon, and simultaneously protect, biodiversity.
The Diversity of Indigenous Agricultural Systems
Diverse agroecosystems are not new to indigenous communities. At its core, biodiversity is about the importance of interrelationships between living organisms. Indigenous understandings of the natural world also emphasize the interdependence of these relationships, recognizing that we must live in balance with our nonhuman relatives.
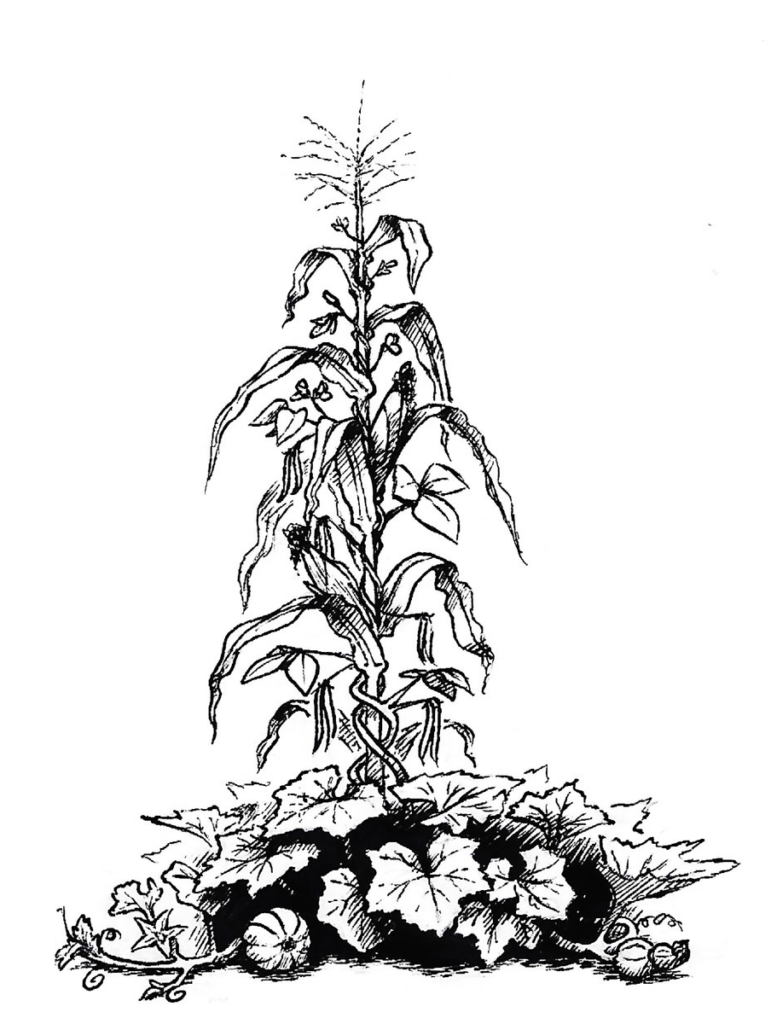
A simple but well-known example of how indigenous communities have long prioritized crop diversity is the Three Sisters—a traditional method of intercropping used by tribal nations (especially those in the northeastern US) for hundreds of years. In the Three Sisters, corn, beans, and squash are planted together; corn provides vertical support for beans, beans provide nitrogen for the soil, and squash provides ground cover, which suppresses weeds and retains moisture in the soil. (It should be noted that the Three Sisters is not merely an agricultural practice but, like many indigenous food practices, has cultural and spiritual significance for the communities who implement it) (Ngapo et al., 2021).
The Three Sisters method is just one of countless examples of indigenous food practices that recognize and honor the profound interrelationships between all living things. Practices like this come from understandings of the land and nonhuman relatives that have been passed down for millennia.
Because of traditional knowledge like this, Native communities are uniquely positioned to champion and protect crop diversity in their agroecologies. After all, ecologists today emphasize that there is no “one size fits all” program for crop diversity, as each region and locality has its own ecosystem filled with unique organisms and interrelationships. Native communities have understood these particularities for centuries, and so it should be no surprise that the data indicates increasing crop diversity on Native lands even as crop diversity decreases nationwide.
In Conclusion
It is NLAP’s hope that this Crop Diversity data dashboard (used in tandem with some of our other tools, such as our What’s Growing on US Native Lands? dashboard) will provide Native communities with data that complements their traditional knowledge as they make informed and sustainable decisions in land, water, and agricultural planning.
It is also our hope that this data can ignite conversations about dismantling exploitative and extractive paradigms of agriculture in order to better promote precious ecosystem biodiversity—for the health and wellbeing of all.
Written by Emma Scheerer
Aguilar, J., Gramig, G.G., Hendrickson, J.R., David W Archer, D.W., Forcella, F., & Liebig, M.A. (2015). Crop Species Diversity Changes in the United States. PLOS One. https://doi.org/10.1371/journal.pone.0136580.
Altieri, Miguel A. (1999). The ecological role of biodiversity in agroecosystems. Agriculture, Ecosystems & Environment, 74(1-3), 19-31. https://doi.org/10.1016/S0167-8809(99)00028-6.
Ngapo, T. M., Bilodeau, P., Arcand, Y., Charles, M. T., Diederichsen, A., Germain, I., Liu, Q., MacKinnon, S., Messiga, A. J., Mondor, M., Villeneuve, S., Ziadi, N., & Gariépy, S. (2021). Historical Indigenous Food Preparation Using Produce of the Three Sisters Intercropping System. Foods, 10(3), 524. https://doi.org/10.3390/foods10030524.
Vandermeer, J., Perfecto, I. (1995). Breakfast of Biodiversity: The Truth about Rainforest Destruction. Food First Books.

