The Native Lands Advocacy Project (NLAP) compiles, consolidates, and visualizes data resources to support sovereign, sustainable, Native-led land planning and protection. All of our data tools are hosted on the Native Land Information System (NLIS). You can read about the history of NLAP here.
We affirm that the federal government has a moral and fiduciary obligation to provide data access, transparency, and control to tribes—especially data that can be used to assess its performance as a self-appointed Trustee. However, because the U.S. government often fails to provide meaningful access to the data collected by external agents about Native citizens, lands, and resources, NLAP is committed to creating free, accessible, and useful data tools from data already in the public domain.
We do this work with the support and guidance of our trusted partners in Indian Country, such as the Indian Land Tenure Foundation, the Native American Agriculture Fund, the Intertribal Agriculture Council, and more. We do not publish tribally-gathered or tribally-owned data on our website, though we do work with tribes one-on-one to assist in the development of private tools upon request. To read more about our commitment to data sovereignty, see this blog post and this page.
Our Data Tools: Dashboards and Maps
Dashboards and maps are NLAP’s primary data tools, housed under the “Data Tools” tab of our website.
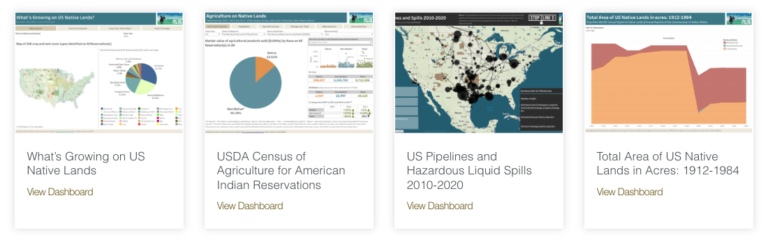
Our Dashboards, some of which are shown above, make large and complex datasets easier to visualize, sort, filter, compare, and analyze. Visuals from our dashboards have been used in presentations, reports, academic articles, news flyers, and more. Our dashboards also allow users to view and filter the raw data, creating a high level of access to the data while removing unnecessary barriers.
Each dashboard has information explaining where the data came from, the limitations it may have, and why it’s relevant to tribal communities. Our dashboards span a wide range of topics for use in land planning, ARMP-IRMP creation, climate adaptation, documentation of historical oppression, and more.
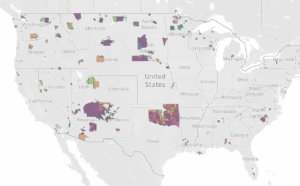
Maps are dynamic, interactive maps that present one or more data layers overlaid with the boundaries of the 574 federally recognized tribes in the U.S. Some of our maps are viewers, such as the National Land Cover Database: Tribal Lands Viewer. Other maps are more complex, such as our Soil Salinity in U.S. Native Lands map, which not only allows users to view the soil salinity map layer, but also presents a pie chart of soil salinity categories for each Native land area.
Our maps allow users to view important trends in thermal activity, drought, intact habitat, and more on reservations. They also allow users to measure distances, draw points and shapes, and export or print maps for their own usage. Like our dashboards, maps have information about where the data came from, the limitations it may have, and why it’s relevant to tribal communities. Scroll below each map to access this information.
Storymaps & Blog Posts
NLAP also publishes storymaps and blog posts to help contextualize and explain our data tools.
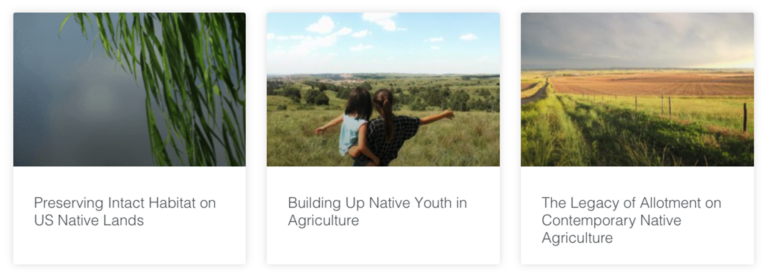
Storymaps (some shown above), also found under the “Data Tools” tab of the NLIS, are dynamic, interactive, and data-rich narratives. Our storymaps are often deep dives into certain data tools, such as our Preserving Intact Habitat on Native Lands storymap, which explains the context surrounding Intact Habitat and why it’s significant for Native Lands, while also providing a tutorial of how to use our Intact Habitat map.
We also use storymaps to provide historical context for the content of our site. For example, our Legacy of Allotment storymap walks through critical historical agriculture policies that have shaped Native lands, economies, and food systems. This storymap focuses primarily on the Dawes Act, also known as the General Allotment Act, and uses the most recent data from the USDA Census of Agriculture for American Indian Reservations to illustrate the devastating and intergenerational impacts of allotment, while also highlighting the ways Native communities are leading efforts to recover and grow beyond these impacts.
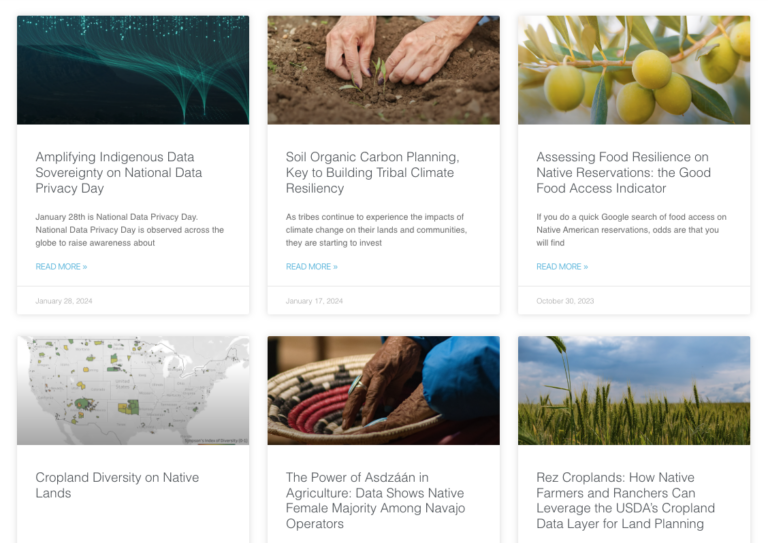
Our blog posts, some of which are shown above, also provide context for our website’s content and act as tutorials for our data tools, but they are shorter-form and less interactive than our storymaps. Our blog posts cover a vast array of topics and tend to highlight interesting data points from our tools.
Data Portals & Topics
Our Data Portals and Topics tabs used to be housed under one heading titled Thematic Hubs. However, as NLAP’s body of work has grown, we’ve recently made the decision to separate these into two distinct categories for ease of use.
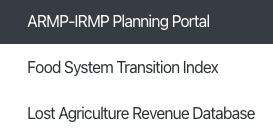
Firstly, our Data Portals are distinct spaces with curated data tools, educational resources, and process guides for a specific purpose. For example, our ARMP-IRMP Planning Portal containes the relevant tools and guides to assist tribes in creating Agricultural Resource Management Plans (ARMPs) and Integrated Resource Management Plans (IRMPs). Each of these portals has information about its purpose and how to use the tools within it. Keep an eye out for our upcoming Climate Data Portal, which will be hosted under this tab!
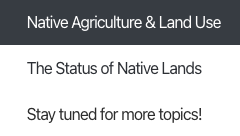
In contrast, our Topics are curated collections of data tools based on their subject matter. These topical pages are not designed for any specific purpose, but instead to hep users access tools in the subjects they’re interested in. NLAP is currently working on building more topic pages for our users.
Start exploring data tools on the NLIS today!
We hope this simple guide has helped introduce you to the many tools on the NLIS. Select a category below to begin exploring now, or contact us with any questions or suggestions you may have.
Data Dashboards
Our interactive dashboards make it possible to filter, compare, and explore the data, making complex data understandable.
Thematic Maps
Thematic maps allow you to visually explore & interact with various data layers across a landscape.
Storymaps
Storymaps are dynamic, interactive, and data-rich narratives that put data into context and inspire action.
Blog Posts
Our blog posts cover a vast array of topics and tend to highlight interesting data points from our tools.
Originally published February 27, 2024.