New to the NLIS? Start here!
The Native Lands Advocacy Project (NLAP) compiles, consolidates, and visualizes data resources to support sovereign, sustainable, Native-led land planning and protection.
Keystone Data Tools for Native Land Planning: View the webinar recordings & share your feedback
This month, the Native Lands Advocacy Project (NLAP) wrapped up our webinar series: Keystone Data Tools for Native Land Planning. These webinars introduced attendees to three foundational datasets that Native Nations & citizens can use to make informed, sovereign decisions for their futures: The USDA Census of Agriculture for American Indian Reservations The National Land […]
Empowering Tribal Climate Adaptation Through Data

Learn more about the first-of-its-kind Climate Data Portal for US Native Lands—designed to strategically support tribal climate planning.
Introducing the Climate Data Portal for U.S. Native Lands

The Native Lands Advocacy Project (NLAP) is thrilled to announce the launch of our Climate Data Portal for U.S. Native Lands! Developed with funding from the Native American Agriculture Fund, this portal is the result of our dedicated GIS team’s efforts to create & consolidate relevant climate-related data tools into one living resource. NLAP acknowledges […]
Check Out These Data Tools for Native Farmers & Ranchers

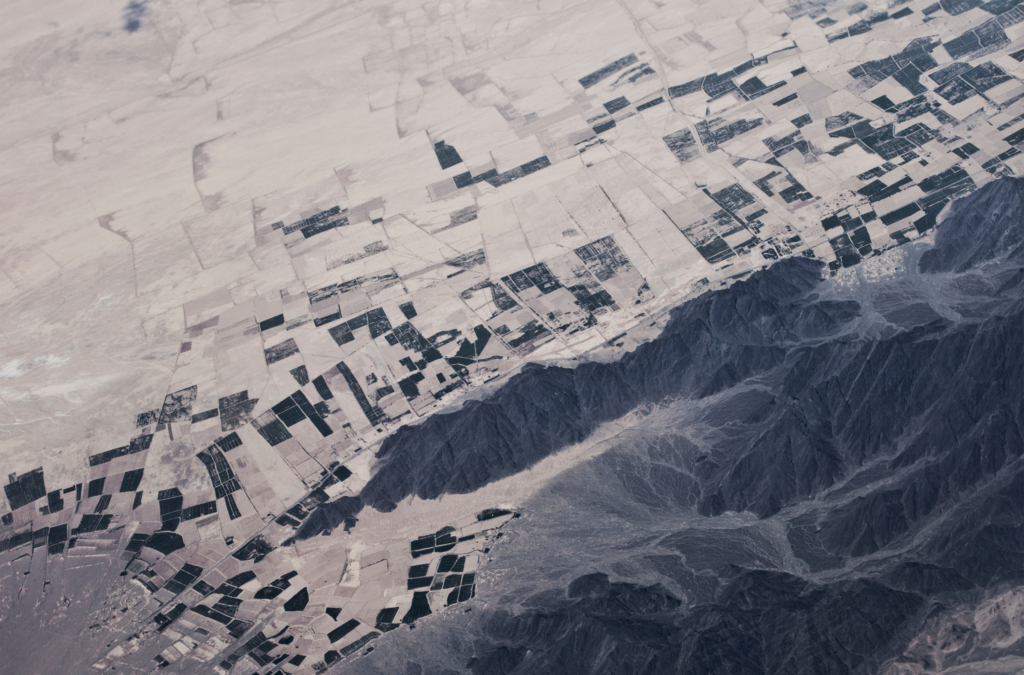
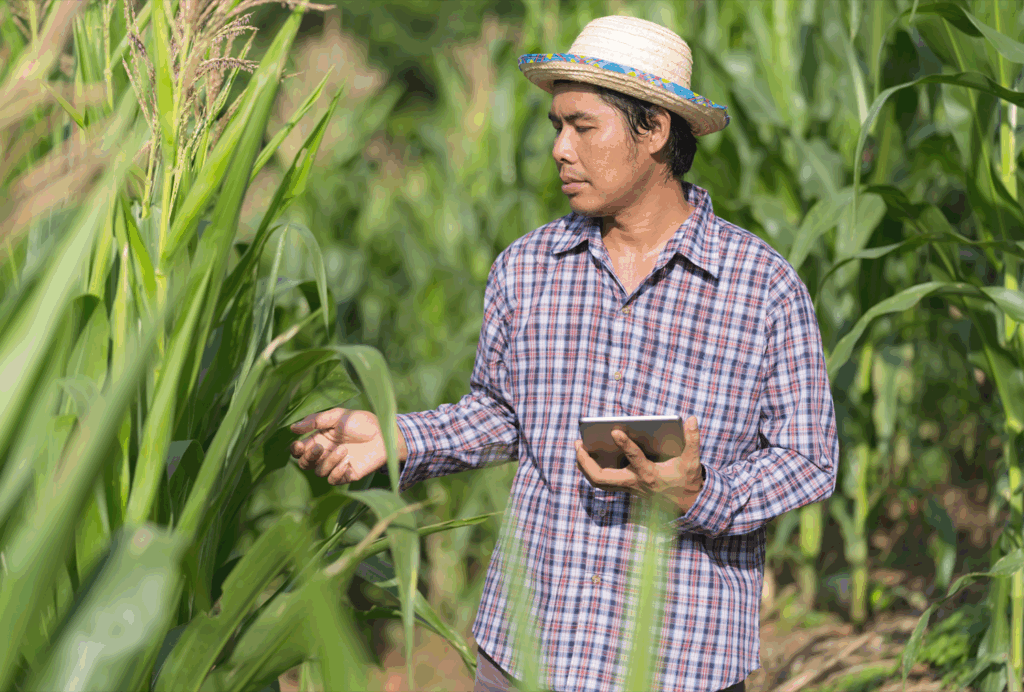
Native farmers and ranchers are major contributors to their reservation economies, food systems, and land stewardship. Recognizing this, NLAP has created dedicated pages of Data Tools for Native Farmers and Data Tools for Native Ranchers. Read more about these pages here.
Tree Canopy Coverage Viewer
This viewer shows the canopy cover percentages in 2021 and changes in proportion of land surface covered by trees in the native lands across the United States.
Elevation Profile Explorer
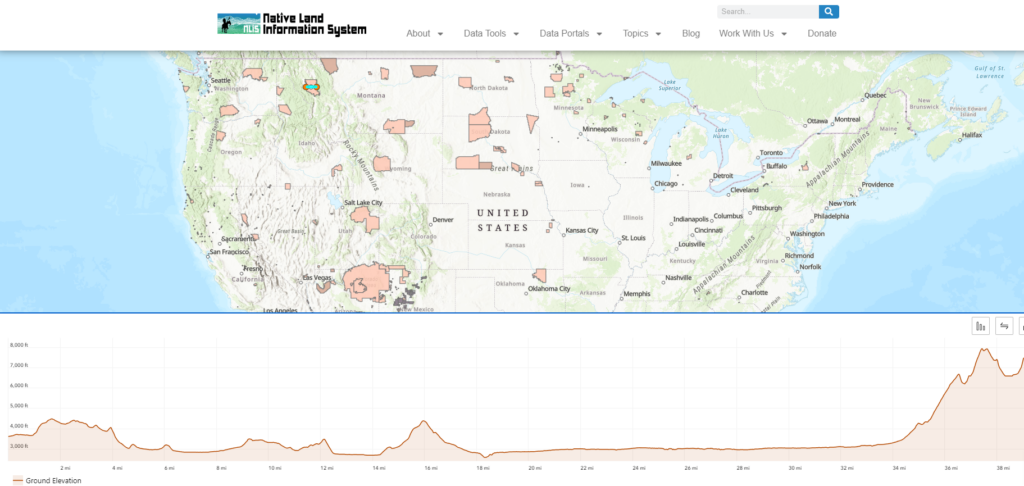
Welcome to the Elevation Profile Explorer, a powerful tool designed to help you understand the terrain and elevation changes across Native lands in the United States.
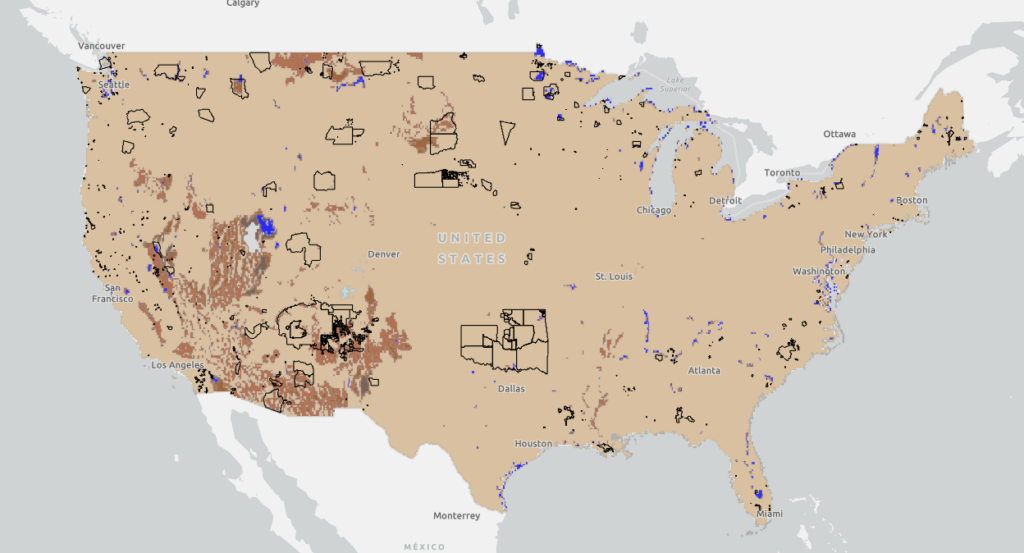
SSURGO Soil Classification Viewer for US Native Lands
This map shows the canopy cover percentages and land cover types on Reservations and USFS lands.
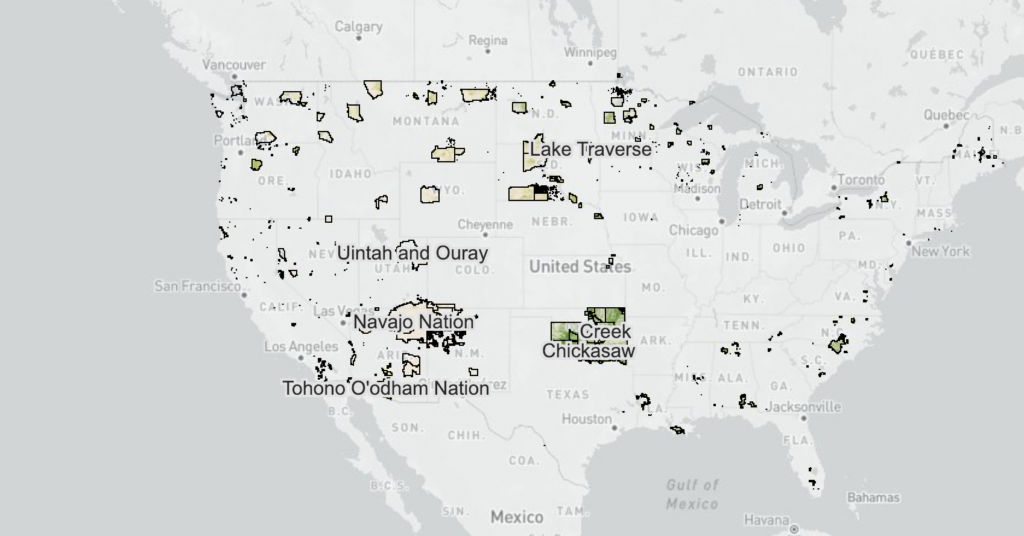
Soil Salinity in U.S. Native Lands
This map displays soil salinity data layers derived from the Harmonized World Soil Database (HWSD) Global Soil Quality – Constraints due to Excess Salts (HWSD Excess Salts). This Soil Salinity data on US Native Lands is presented here as a potential resource for Tribes to use in natural resource and climate adaptation assessment and planning.
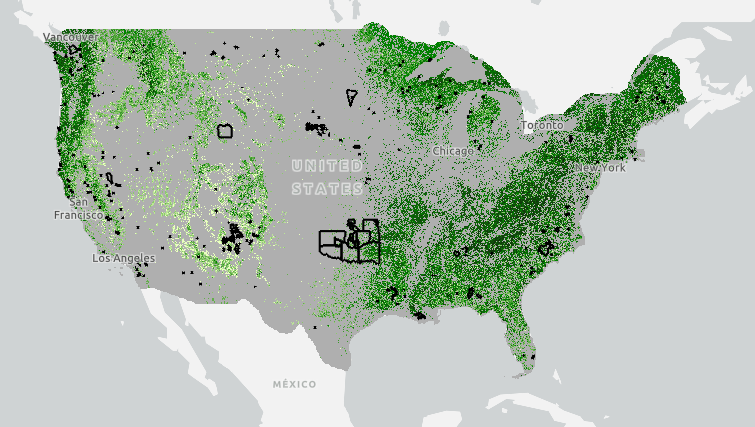
Crop Diversity on US Native Lands
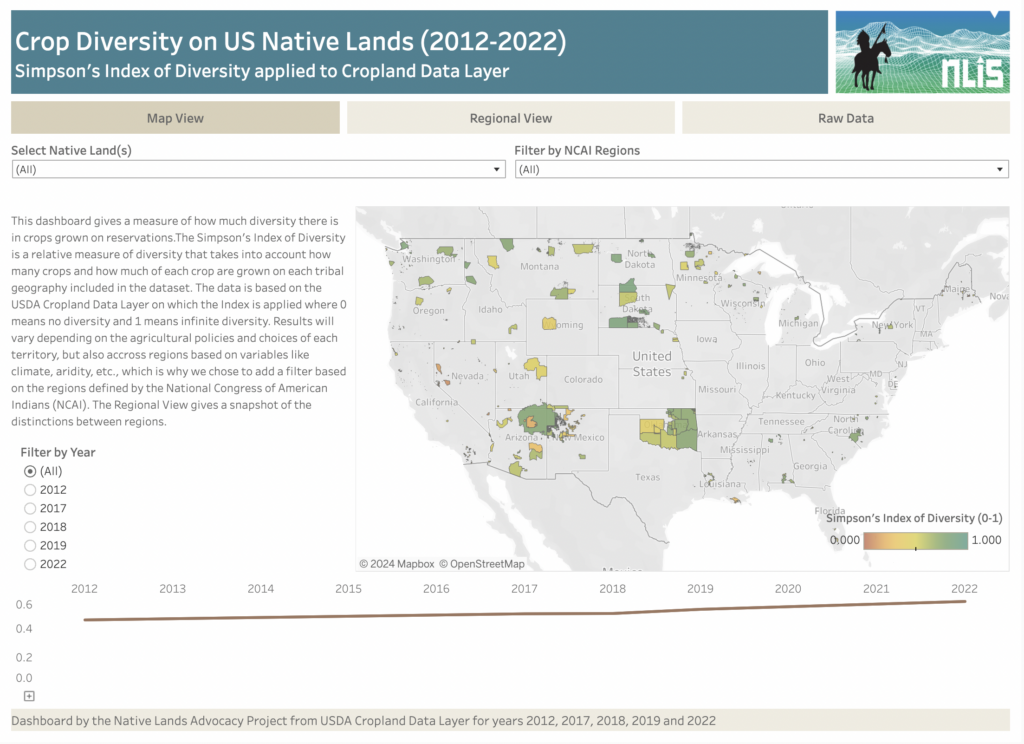
About this Dashboard The Crop Diversity Dashboard is an estimate of the relative diversity of crops grown on tribal lands. We use the Simpson’s Index of Diversity to estimate crop diversity from both the variety of crops grown and their respective acres within each reservation, with 0 meaning no crop diversity and 1 meaning infinite […]
Species Richness on US Native Lands
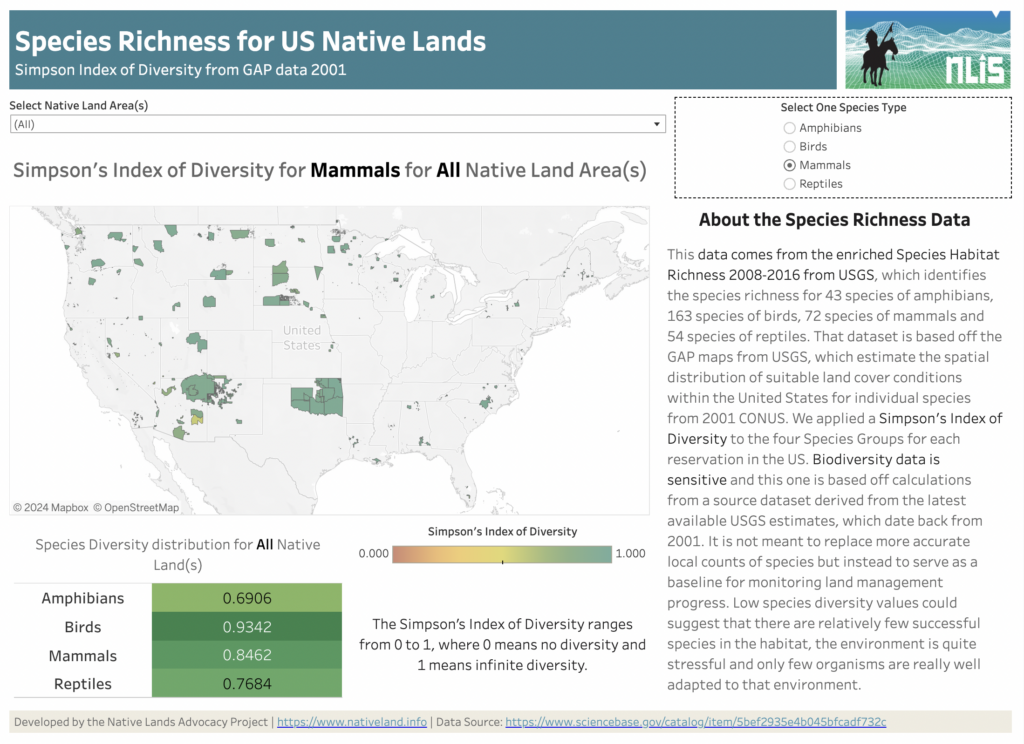
About this Dashboard Water Stress Categories 0 Native Land Areas 0 Datasets utilized 0 Possible Visualizations 0 About the Data This data comes from the Species Habitat Richness 2008-2016 from USGS, which identifies the species richness for 43 species of amphibians, 163 species of birds, 72 species of mammals, and 54 species of reptiles. This […]
Agricultural Water Stress on US Native Lands
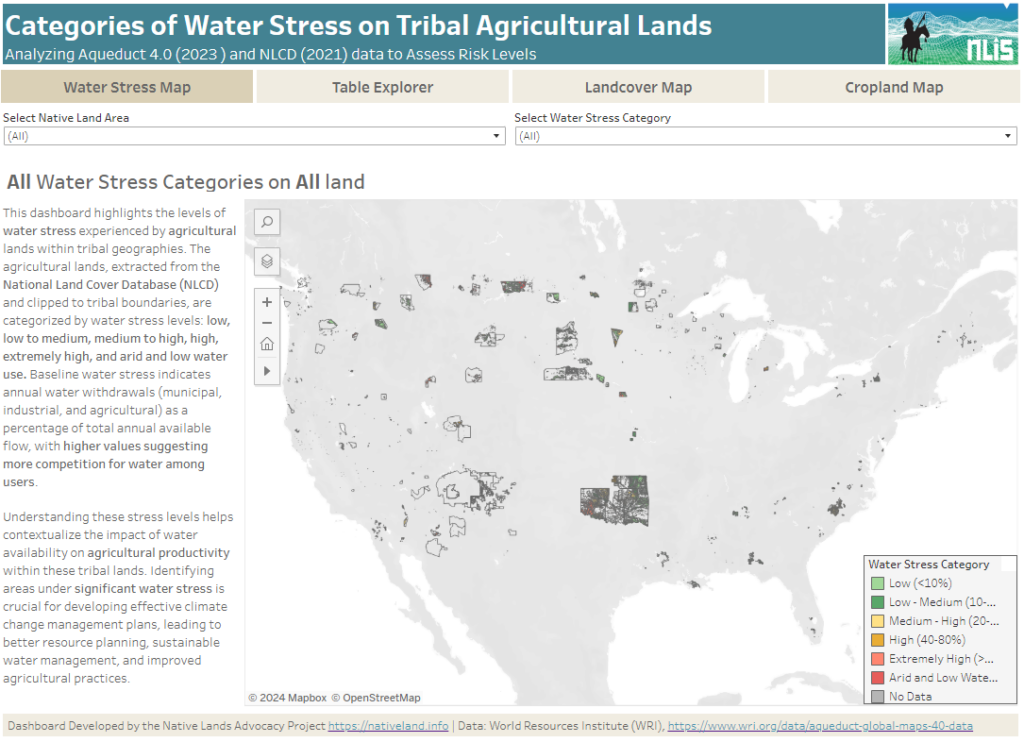
About this Dashboard This data dashboard summarizes data from the World Resources Institute, and the National Land Cover Database for Native Lands in the United States. It highlights the distribution and impact of water stress on agricultural lands within Native boundaries. The dashboard features detailed maps and interactive elements, allowing users to explore different water […]