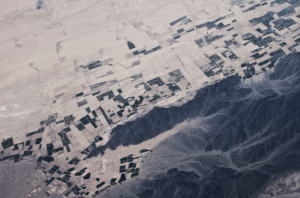
According to summary statistics from the USDA’s Cropland Data Layer (CDL), there were about 110 million acres of cropland (5.7%) on Native American reservations (including on-reservation and off-reservation trust lands).*
What are these croplands and land covers? How have they changed over time? Why does this data matter?
NLAP’s What’s Growing on US Native Lands Dashboard and its integration of the most recent 2022 cropland data allow tribes to answer these questions for their own land and agricultural planning.
History Behind the Cropland Data Layer
When discussing Native agriculture, we must acknowledge the inability of national agricultural datasets to capture the full scope of reservation lands and food systems. While the CDL can only speak to large-scale mono-cropped agriculture, Native communities can still combine this data with their local and traditional knowledge to determine the best course of action for their lands.
The USDA created the CDL to provide acreage estimates to the Agricultural Statistics Board via satellite imagery. This effort allowed farmers, ranchers, and other land professionals to assess their croplands and land cover using digital, crop-specific, and geo-coordinated satellite data. However, a shortcoming in producing this data is that this data was not made accessible to tribes with respect to Native geographies. This lack of access is an issue if we desire tribes to have all the tools possible to easily monitor their lands over time. As a result, NLAP developed this dashboard to give tribes an easy-to-use resource that allows them to assess cropland and land cover on their lands and make nationwide comparisons.
So, what does the data say?
Major Land Cover Types
According to the dashboard, the most prominent land covers on Native reservations in the contiguous U.S. (when you consider all reservations combined) are shrublands (33.8 million acres), grasslands (28.7 million acres), and evergreen forests (12.2 million acres). Of course, land cover and cropland will vary from reservation to reservation, but these top three can inform tribal land caretakers about what the border landscape looks like for Native Nations. For example, these land cover types present great opportunities for tribal climate planning and mitigation.
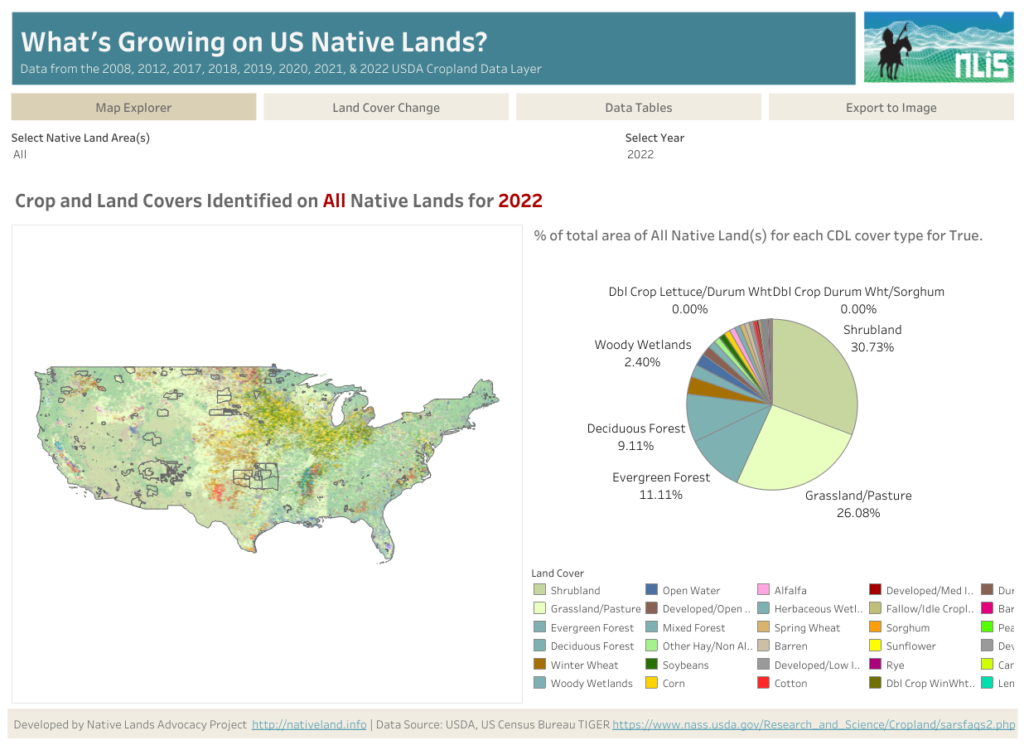
As mentioned in our grasslands storymap, shrublands and grasslands can help reduce soil erosion and soil organic carbon loss. Evergreen forests also play a part in off-setting fossil fuel emissions and improving air quality for tribal lands.
As these cropland types become a part of the answer to rebuilding healthy tribal lands and communities, tribes are also planning for their protection and rightful stewardship. More than preserving these lands as major commodities, Native farmers and ranchers know that protecting these precious ecosystems is key for greater land and water protection. And although these are the most prominent land covers on Native reservations, they often bear the brunt of climate-related losses.
What Happened to Grasslands?
According to the CDL, since 2008, grasslands and pasture lands on Native lands have been declining, going from 32.7 million acres in 2008 to 28.7 million acres in 2022 (a nearly 12% decrease). The data show that the most alarming drop in grassland acreage happened between 2012 and 2017.
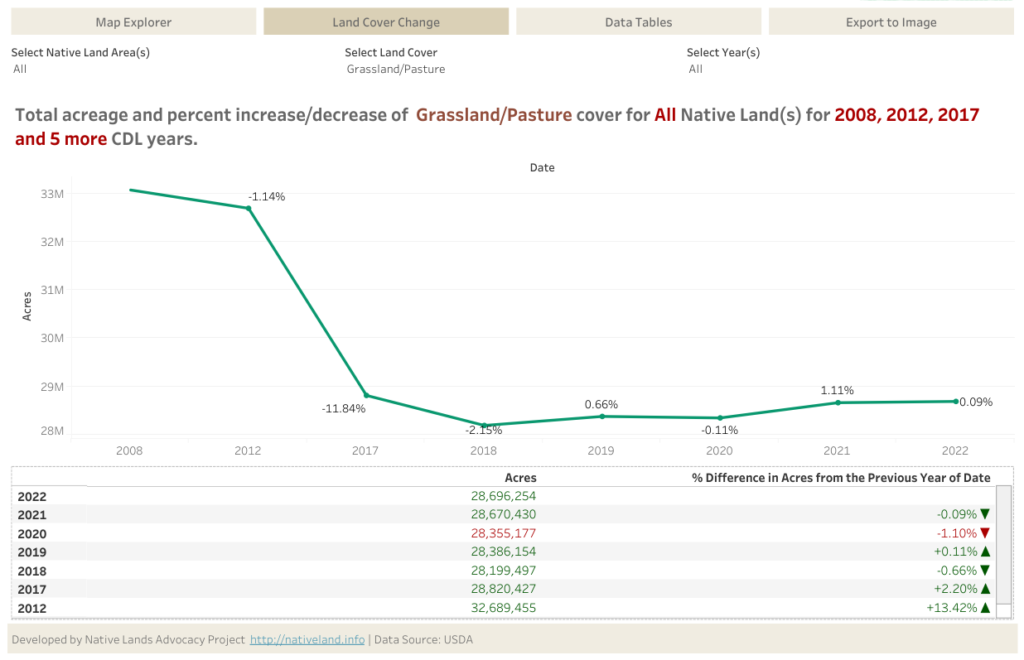
Although small increases in grassland acreage have occurred in recent years, Native land caretakers must still grapple with how these losses impact tribal agriculture, biodiversity, habitat, and climate resilience.
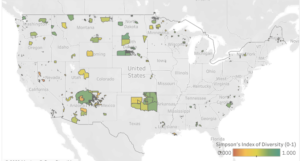
In addition to exploring the CDL data in this dashboard, Native land caretakers may also find our Soil Organic Carbon for Land Planning Dashboard and our Cropland Diversity Dashboard helpful in sustainable cropland planning. These two dashboards provide baseline measures for Native land professionals who desire to enhance soil organic carbon and cropland diversity on Native lands.
Dedicated blog posts for these tools are coming soon!
Why Does This Data Matter?
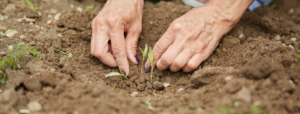
The agricultural and land data made available by major federal government entities still has a long way to go in providing accurate, timely, and comprehensible data to tribes and their Native farmers and ranchers so that tribes may continue caring for their lands on a larger scale. Equipped with deeply rooted traditional knowledge, Native farmers and ranchers already know how to tend their lands best and correct ecological imbalances… and the addition of reliable data tools and data resources help to enhance that stewardship.
This data dashboard can be a handy resource for tribes to enhance their assessment of climate vulnerabilities, identify the needs of their land caretakers, and even estimate their reservation’s carrying capacity to feed their communities. Although many of these public datasets are still structured in a way that does not satisfy Indigenous indicators of land health, tribes can still leverage the USDA data to their benefit.
Visit our ‘What’s Growing on U.S. Native Lands’ Dashboard to see cropland statistics for your reservation and what unique opportunities exist for your Native land caretakers.
*Using the CDL alone, we cannot estimate how much of these croplands and land covers are stewarded by Native peoples on the reservation. According to self-reported data from the most recent USDA Census of Agriculture, we know that, for the 73 reservations included, nearly 80% of reservation croplands (in acres) is controlled by non-Natives. Therefore, as we explore these land types on Native reservations, we must bear in mind the disparities that exist in land access for Native communities and how these numbers do not fully capture Native-stewarded croplands in all areas of the reservation. See our Agriculture on Native Lands Dashboard and our Legacy of Allotment of Contemporary Native Agriculture Storymap for more information.
Written by Raven McMullin