As part of our commitment to increasing Native access to data that empowers informed decision-making, the Native Lands Advocacy Project (NLAP) recently published three data dashboards that focus on federal spending as it relates to tribes. Our new storymap walks through each of these tools and shows users how to access relevant data about federal investments in Indian Country. Read on to learn more about the three data tools!
Federally Funded Projects in Indian Country
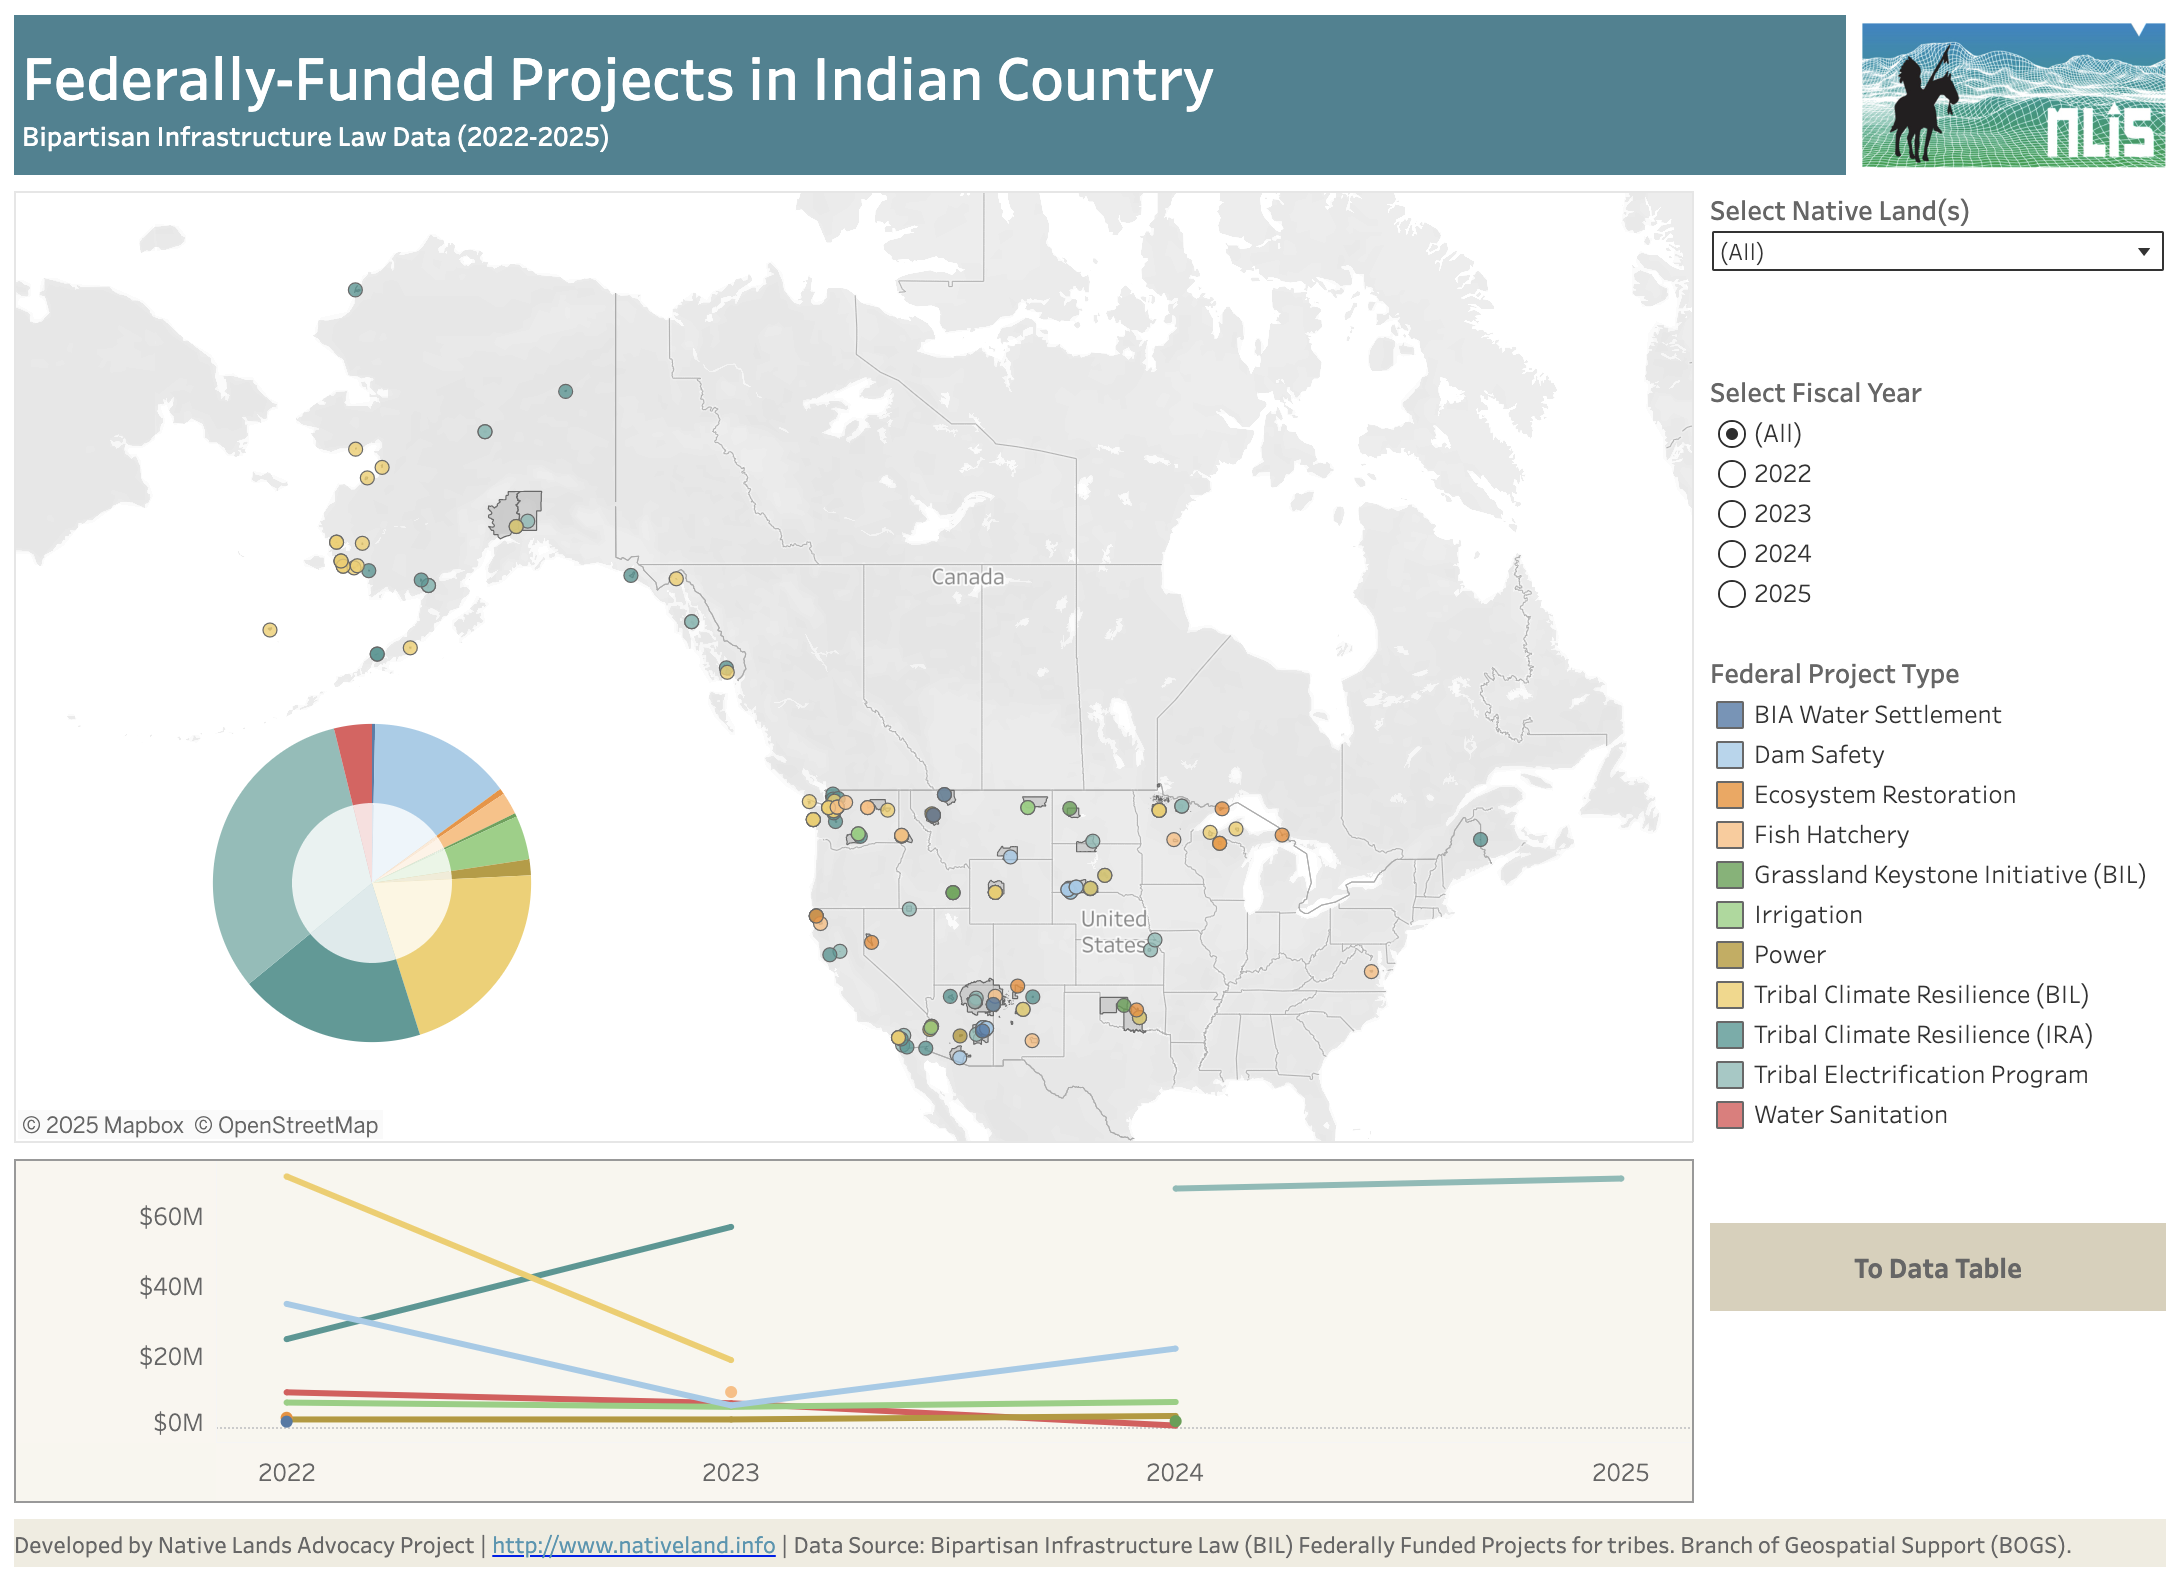
The Federally Funded Projects in Indian Country dashboard displays data about projects within tribal boundaries that were funded by the Bipartisan Infrastructure Law and/or the Infrastructure Reduction Act. These two Biden-era acts allocated billions of dollars both directly into tribal communities and to the federal agencies responsible for overseeing Indian Affairs.
The ability to easily and accurately identify where these federal investments in Indian Country have gone is important for tribes in evaluating the efficacy and equity of these programs. This dashboard visualizes data from the years 2022 to 2025 and can be filtered according to the federal project type and the Native land area.
Bureau of Indian Affairs Budget Breakdown

The Bureau of Indian Affairs (BIA) Budget Breakdown dashboard summarizes data from the Bureau of Indian Affairs Yearly Highlights Reports, which show BIA spending by categories, programs, and sub-programs for the years 2022 to 2025. NLAP digitized these static reports to visualize the data interactively and bring more transparency into government spending.
Farm Service Agency Disbursements Across U.S. Lands

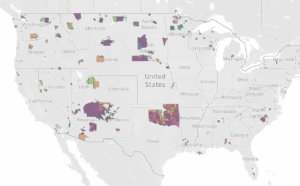
The FSA Disbursements Across U.S. Lands dashboard offers insight into how funds are distributed across different Farm Service Agency (FSA) programs. It visualizes data for funding recipients on Native and non-Native lands, allowing for a comprehensive overview of funding trends as well as comparative analyses.
Learn More About These Federal Investments in Indian Country
Interested in learning more about these data & seeing demonstrations of how to navigate these tools? Check out our Federal Spending storymap!