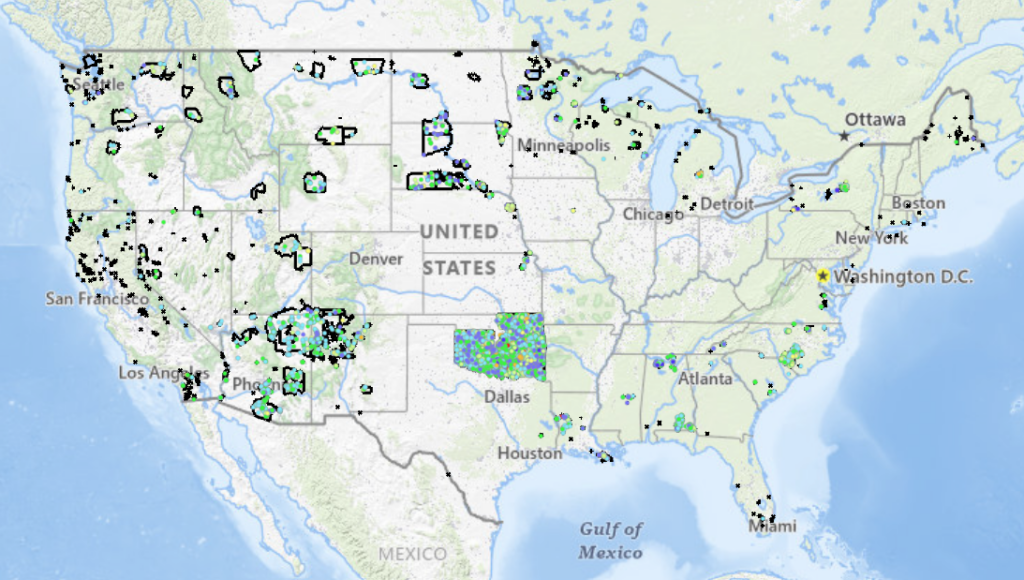
Available Water in Soil on US Native Lands
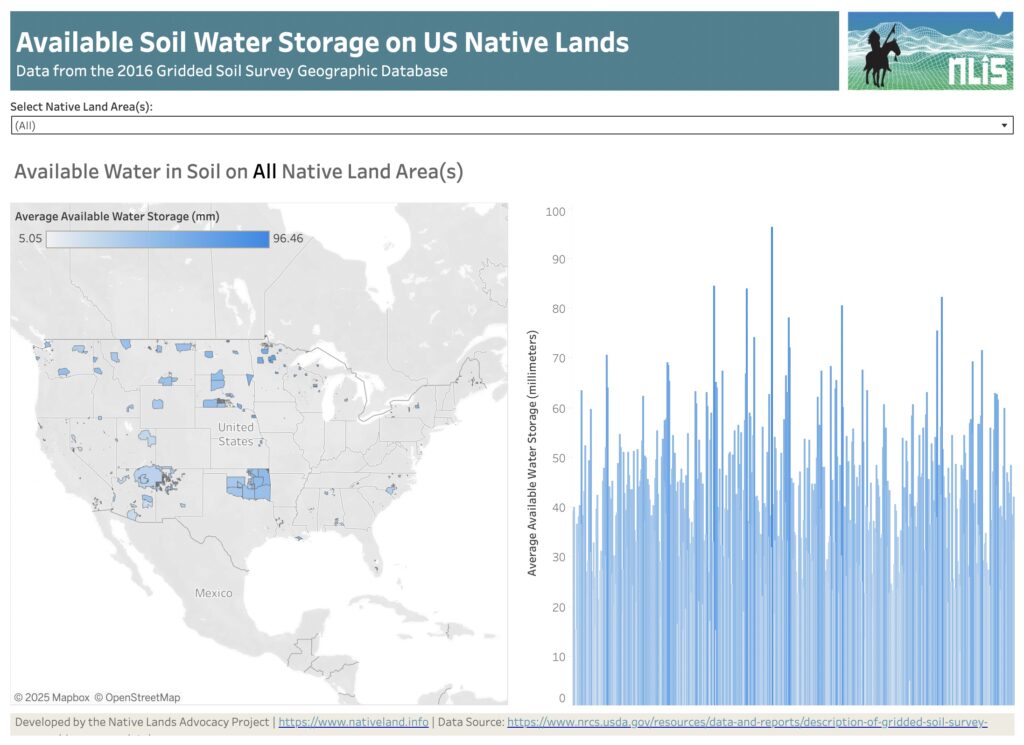
About this Dashboard This dashboard features a reservation-level view of the available water data in soil on all tribal lands in the US. Data comes from the USGS Gridded soil survey for 2016. The “available water in soil” variable from gridded soil surveys refers to the quantity of water that a soil can store and […]
Introducing Our New Storymap: Water is Life: Native Efforts to Restore Water Systems
The Native peoples of North America have been caretakers of their lands and natural resources long before colonial contact, and they are the ones who stand on the front lines when our water systems are being threatened. Our new storymap delves into the cultural significance of water to Native communities and how their unique perspectives […]
New to the NLIS? Start here!
The Native Lands Advocacy Project (NLAP) compiles, consolidates, and visualizes data resources to support sovereign, sustainable, Native-led land planning and protection.
Water is Life: Native Efforts to Restore Water Systems
Native American efforts to protect our water systems are integral to the restoration and preservation of this non-human relative.
These Water-Focused Data Tools Support Tribal Land & Climate Planning
The Native Land Information System (NLIS) is home to over 120 public, free data tools and resources that were created to support tribal communities in developing climate-smart land management strategies. We are excited to share some of our new water data tools with you, as well as reintroduce you to some of our earlier water-related […]
Empowering Tribal Climate Adaptation Through Data

Learn more about the first-of-its-kind Climate Data Portal for US Native Lands—designed to strategically support tribal climate planning.
Introducing the Climate Data Portal for U.S. Native Lands

The Native Lands Advocacy Project (NLAP) is thrilled to announce the launch of our Climate Data Portal for U.S. Native Lands! Developed with funding from the Native American Agriculture Fund, this portal is the result of our dedicated GIS team’s efforts to create & consolidate relevant climate-related data tools into one living resource. NLAP acknowledges […]
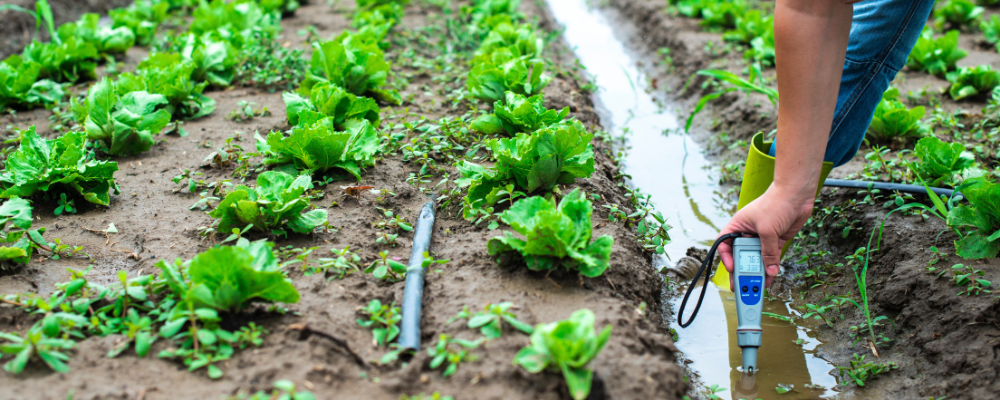
Water Quality Viewer – Pesticides
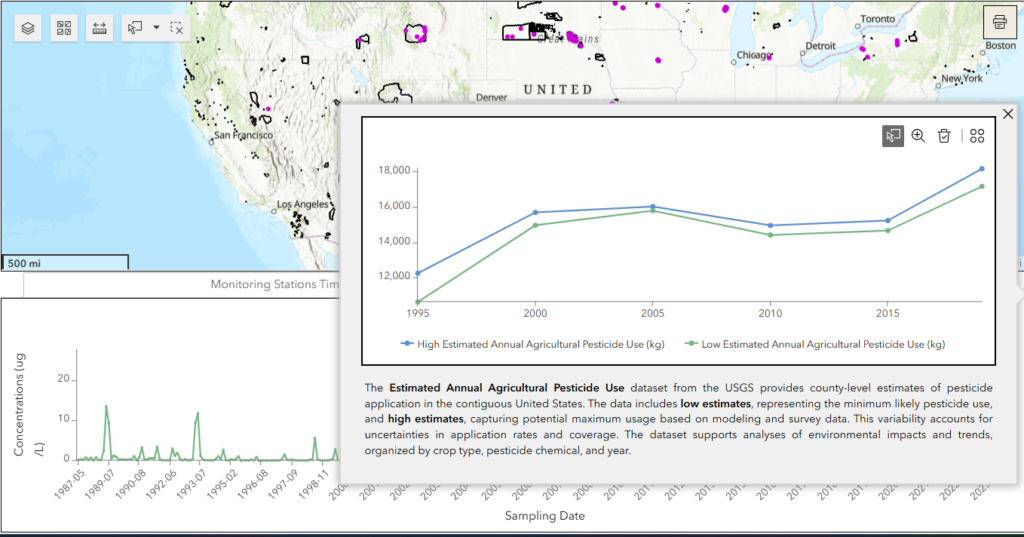
Explore pesticide concentrations in groundwater and surface waters, as well as estimated agricultural pesticide use, across US Native Lands with this interactive dashboard. Users can select specific Native Lands, filter data by pesticide, year range, and water type, and visualize trends in pesticide concentrations and use. The dashboard includes both monitoring-level data from water-quality stations and county-level pesticide use estimates, providing a comprehensive view of pesticide impacts on these vital ecosystems.
Water Quality Viewer – Temperature
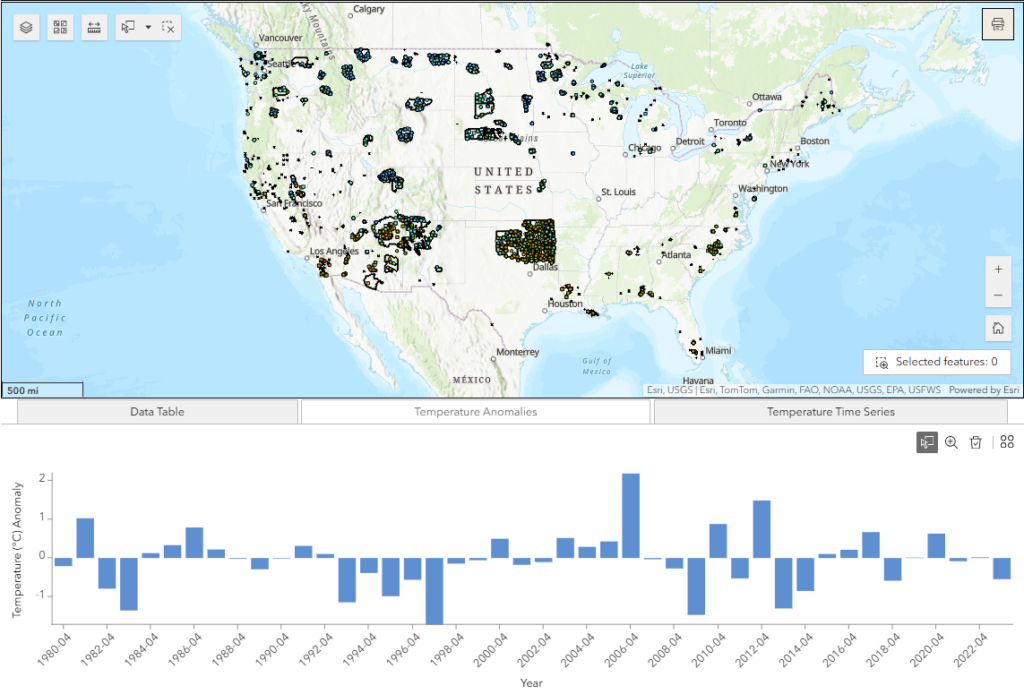
Explore the local temperature measurements across groundwater and surface waters of US Native Lands with this interactive dashboard. Users can select specific Native Lands, filter data by month and year range, and visualize trends to better understand local temperature changes in these vital ecosystems.
Water Quality Viewer – pH and Hypoxia
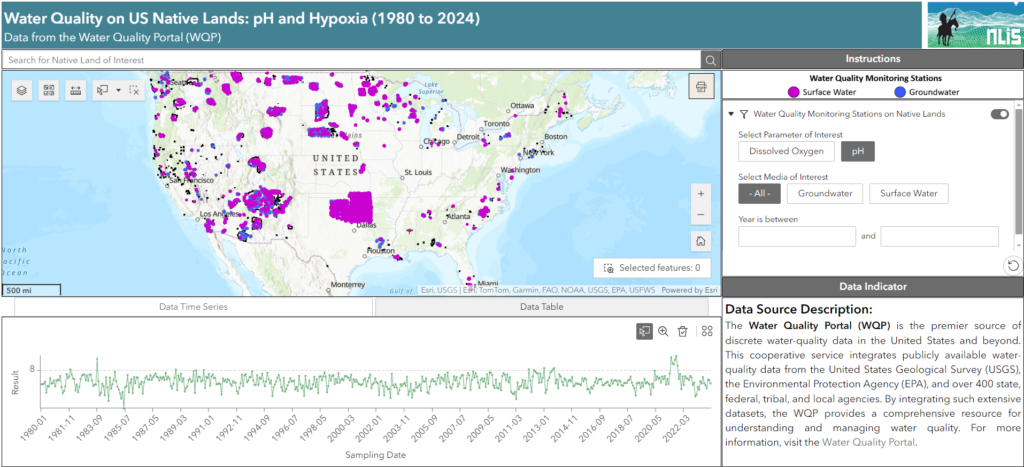
Explore the pH and dissolved oxygen levels across groundwater and surface waters of US Native Lands with this interactive dashboard. Users can select specific Native Lands, filter data by parameter and year range, and visualize trends to better understand hypoxia and water quality in these vital ecosystems.
Culvert Condition Viewer
Explore Tribal Lands in the lower 48 states with this interactive map, showcasing culvert conditions and National Bridge Inventory (NBI) ratings to support environmental analysis and decision-making.
Elevation Profile Explorer
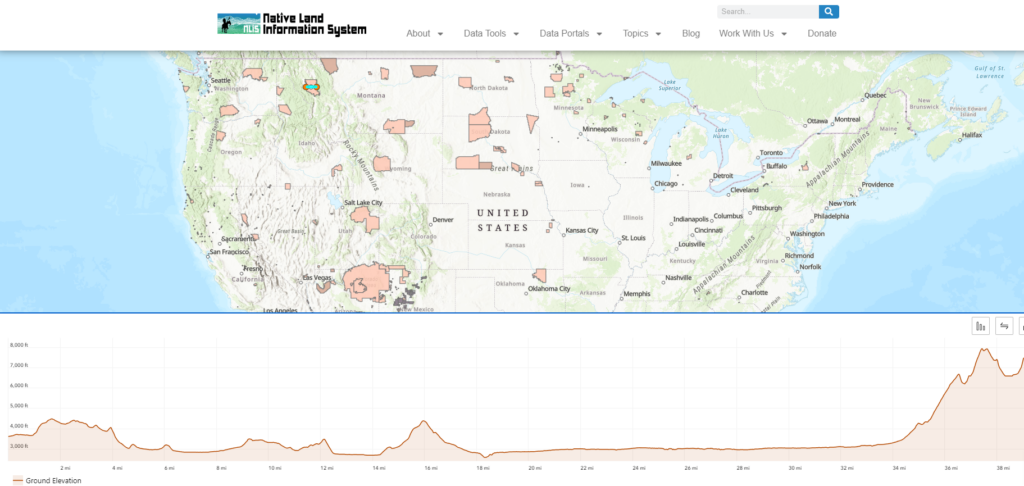
Welcome to the Elevation Profile Explorer, a powerful tool designed to help you understand the terrain and elevation changes across Native lands in the United States.