The Native Lands Advocacy Project (NLAP) compiles, consolidates, and visualizes data resources to support sovereign, sustainable, Native-led land planning and protection.

The Native Lands Advocacy Project (NLAP) was founded in 2019 to provide much-needed data support to Native American communities. As

The Native Lands Advocacy Project (NLAP) is pleased to announce our new Sponsorship Program, which allows organizations to pledge funds

Since 2019, the Native Lands Advocacy Project (NLAP), a project of the 501(c)(3) nonprofit Village Earth, has been honored to
Learn about three new data tools that allow users to access relevant data about federal investments in Indian Country.

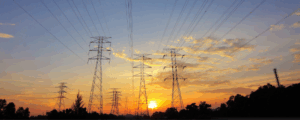
Wind plays a significant role in shaping ecosystems, affecting infrastructure planning, and in overall renewable energy potential. Recognizing this, the
The new Credit Insecurity dashboard by the Native Lands Advocacy Project (NLAP) provides an at-a-glance understanding of tribal access to

Happy Indigenous Peoples’ Day from all of us at the Native Lands Advocacy Project (NLAP)! To mark this significant holiday,

Every year, the United States Congress begins the process of appropriating funds for the following fiscal year. While it’s important
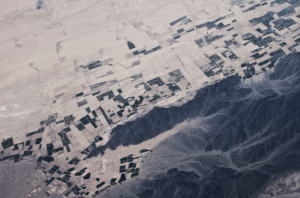
By calculating land dispossession, this report seeks to not only identify what has been taken from Native peoples but also how this theft became the original source of capital that built Colorado and the West.

Learn about three new data tools that allow users to access relevant data about federal investments in Indian Country.