ARMP-IRMP Planning Portal
Agricultural Resources
Find here the key data to fill in the Agricultural Resources Section of your ARMP. Refer back to the ARMP template located on the Getting Started page for more details.
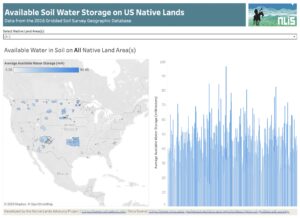
Available Water in Soil on US Native Lands
About this Dashboard This dashboard features a reservation-level view of the available water data in soil on all tribal lands in the US. Data comes
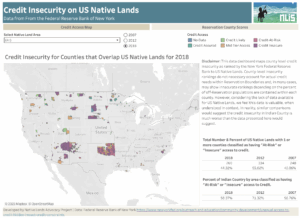
Credit Insecurity on US Native Lands
About this Dashboard This data dashboard maps county-level credit insecurity as ranked by the New York Federal Reserve Bank to US Native Lands. County-level insecurity
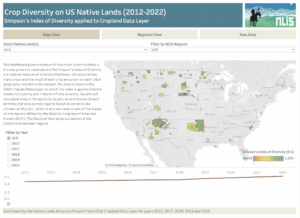
Crop Diversity on US Native Lands
About this Dashboard The Crop Diversity Dashboard is an estimate of the relative diversity of crops grown on tribal lands. We use the Simpson’s Index
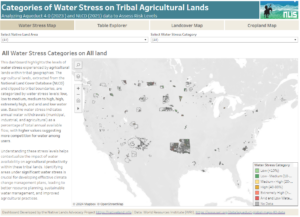
Agricultural Water Stress on US Native Lands
About this Dashboard This data dashboard summarizes data from the World Resources Institute, and the National Land Cover Database for Native Lands in the United
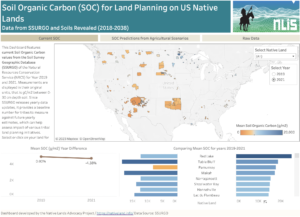
Soil Organic Carbon for Land Planning on Native Lands
About this Dashboard This data dashboard summarizes past and present Soil Organic Carbon (SOC) data for all Native Lands but also future estimates depending on
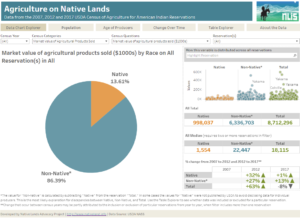
USDA Census of Agriculture for American Indian Reservations
About this Dashboard This dashboard was developed by the Native Lands Advocacy Project to make data from the 2007, 2012, 2017, and 2022 USDA Census of
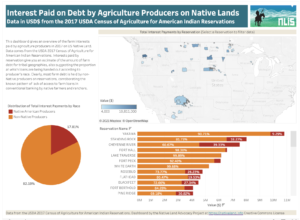
Interest Paid on Debt by Race for Agriculture Producers on Native Lands
About this Dashboard This data dashboard, developed by the Native Lands Advocacy Project summarizes Interests on Farm Debt paid by Agricultural Producers on Native Land
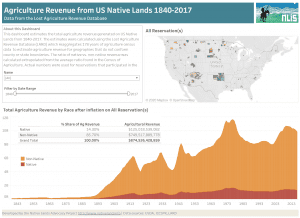
Agriculture Revenue from Contemporary US Native Lands
About this Dashboard This data dashboard, developed by the Native Lands Advocacy Project, estimates the agriculture revenue, adjusted for inflation, for all contemporary Native lands
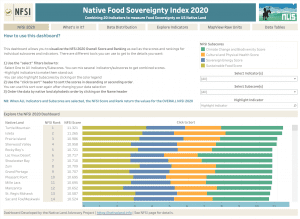
Food-System Transition Index for US Native Lands
Access the Food-System Transition Index page!
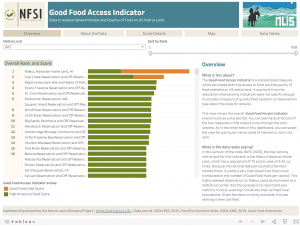
FSTI – Good Food Access Indicator for US Native Lands
Table of Contents About this Indicator The Good Food Access Indicator is a composite score that provides an assessment of both access This indicator
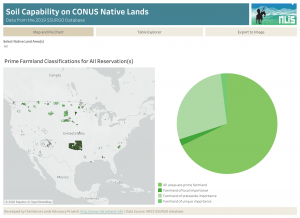
Soil Capability on US Native Lands
About this Dashboard This data dashboard summarizes data from the 2021 Soil Survey for 552 unique Native land areas in the coterminous United States and
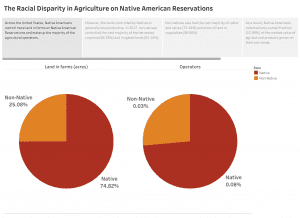
The Racial Disparity in Agriculture on Native Lands
About this Dashboard This data story summarizes data from the 2017 USDA Census of Agriculture for American Indian Reservations as it relates to racial disparity that exists
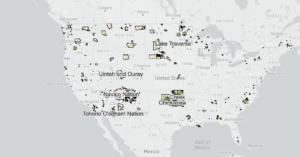
SSURGO Soil Classification Viewer for US Native Lands
This map shows the canopy cover percentages and land cover types on Reservations and USFS lands.
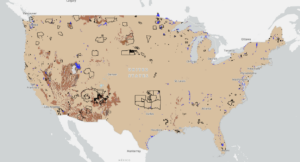
Soil Salinity in U.S. Native Lands
This map displays soil salinity data layers derived from the Harmonized World Soil Database (HWSD) Global Soil Quality – Constraints due to Excess Salts (HWSD Excess Salts). This Soil Salinity data on US Native Lands is presented here as a potential resource for Tribes to use in natural resource and climate adaptation assessment and planning.
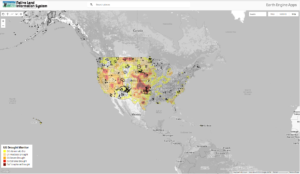
US Drought Monitor (Google Earth Engine)
This map displays US Drought Conditions updated every Thursday as reported by National Drought Mitigation Center (NDMC)
