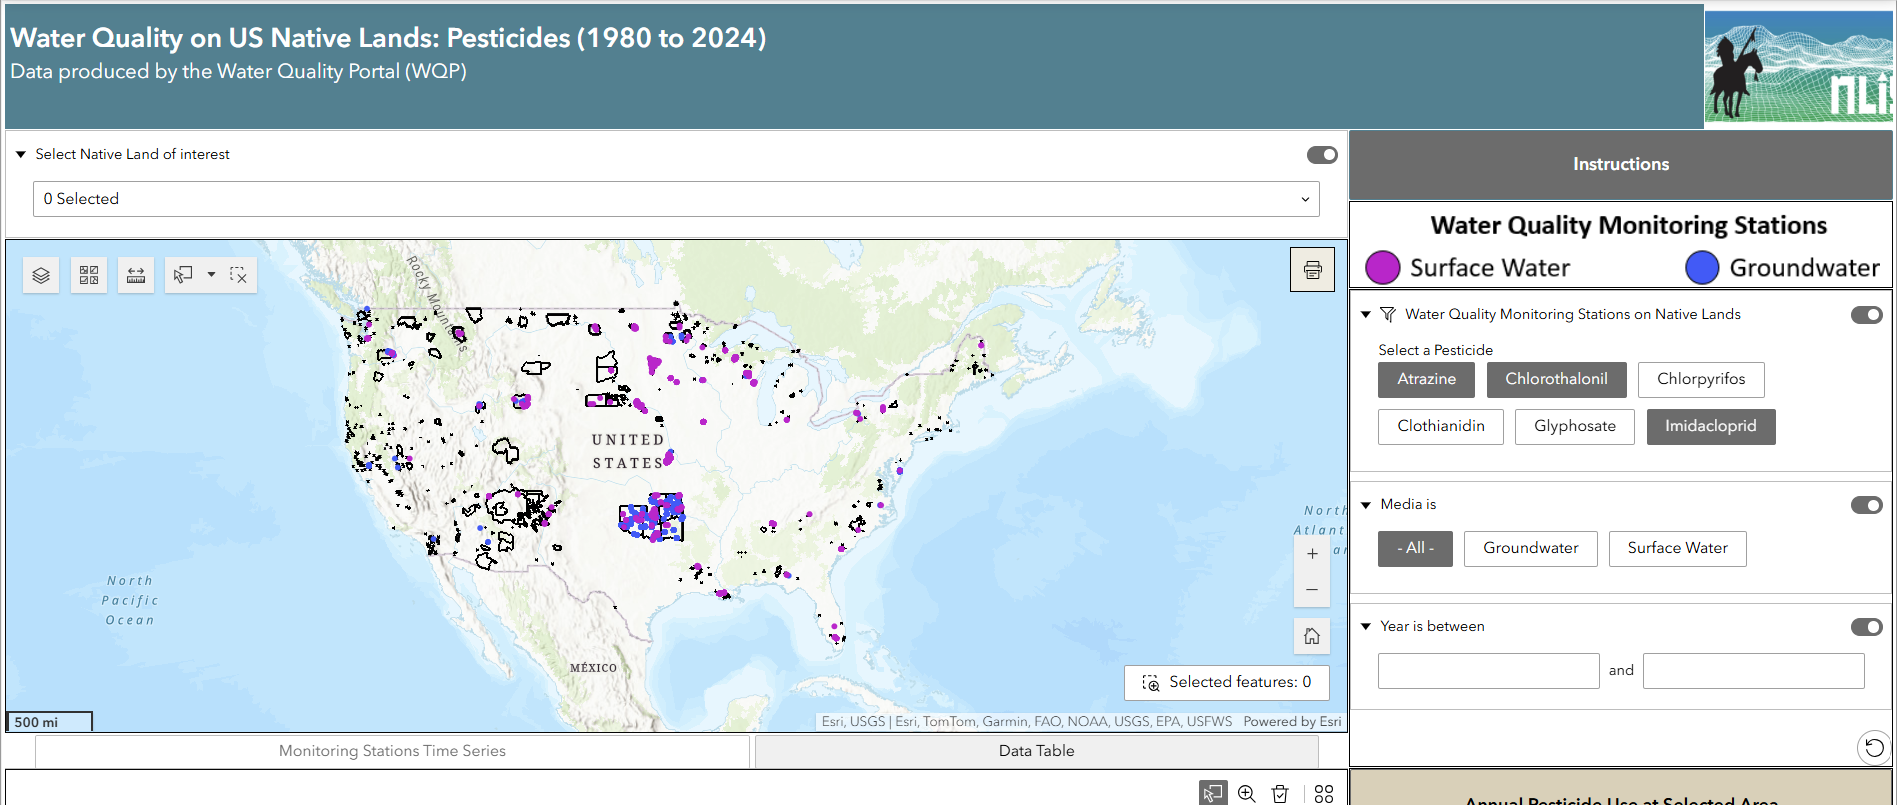
Water Quality Viewer - Pesticides

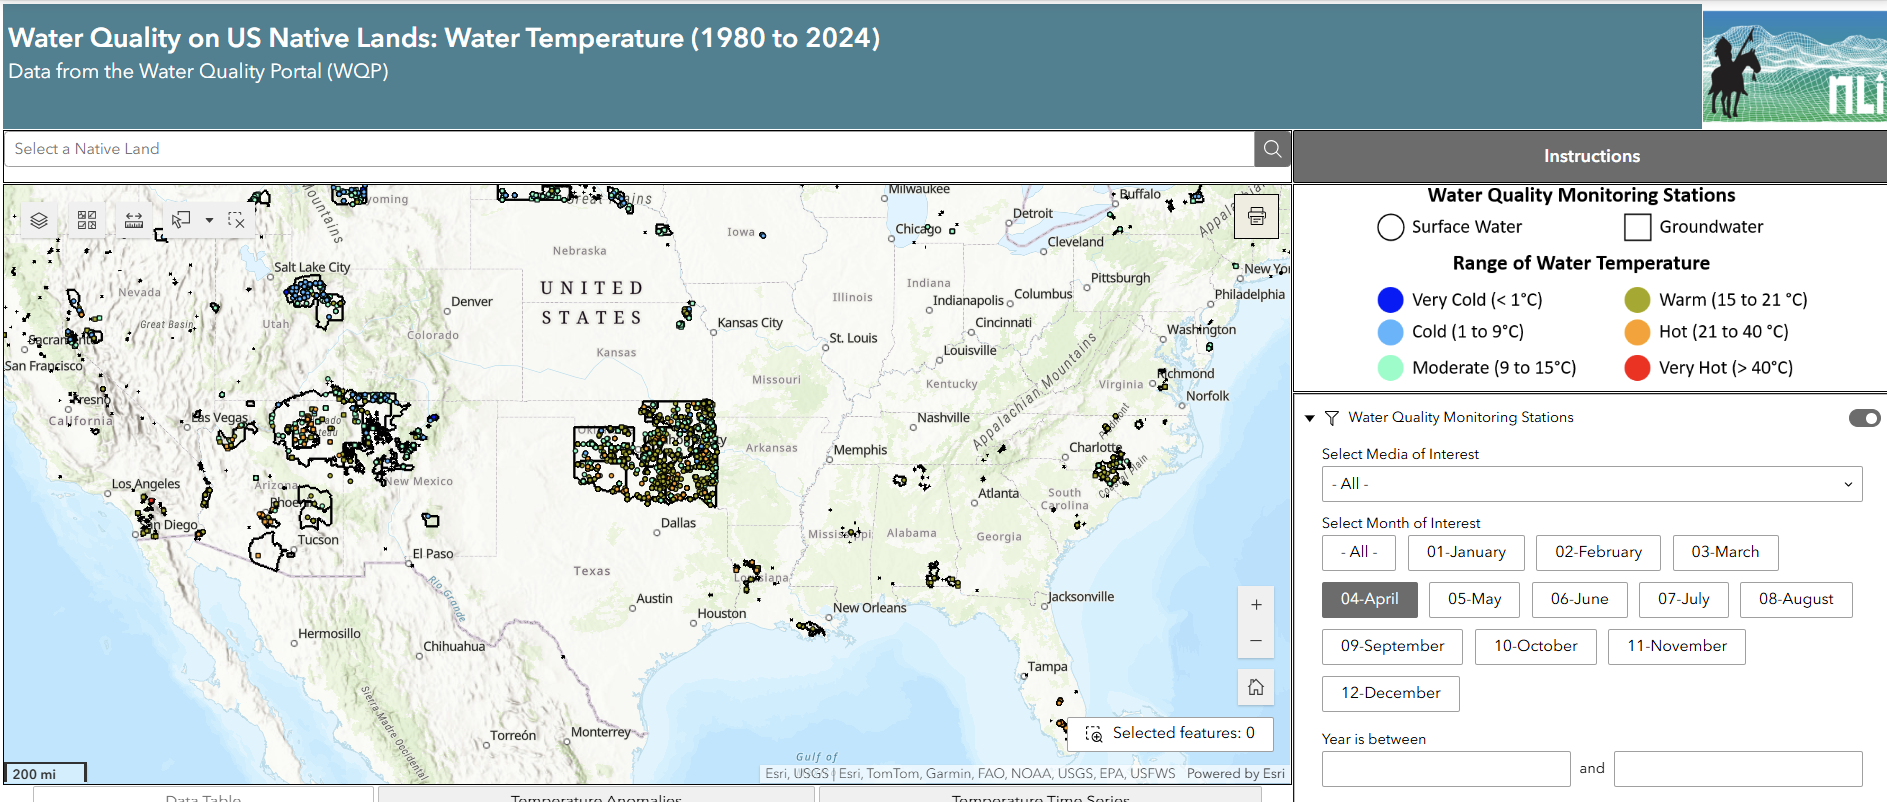
Water Quality Viewer - Temperature
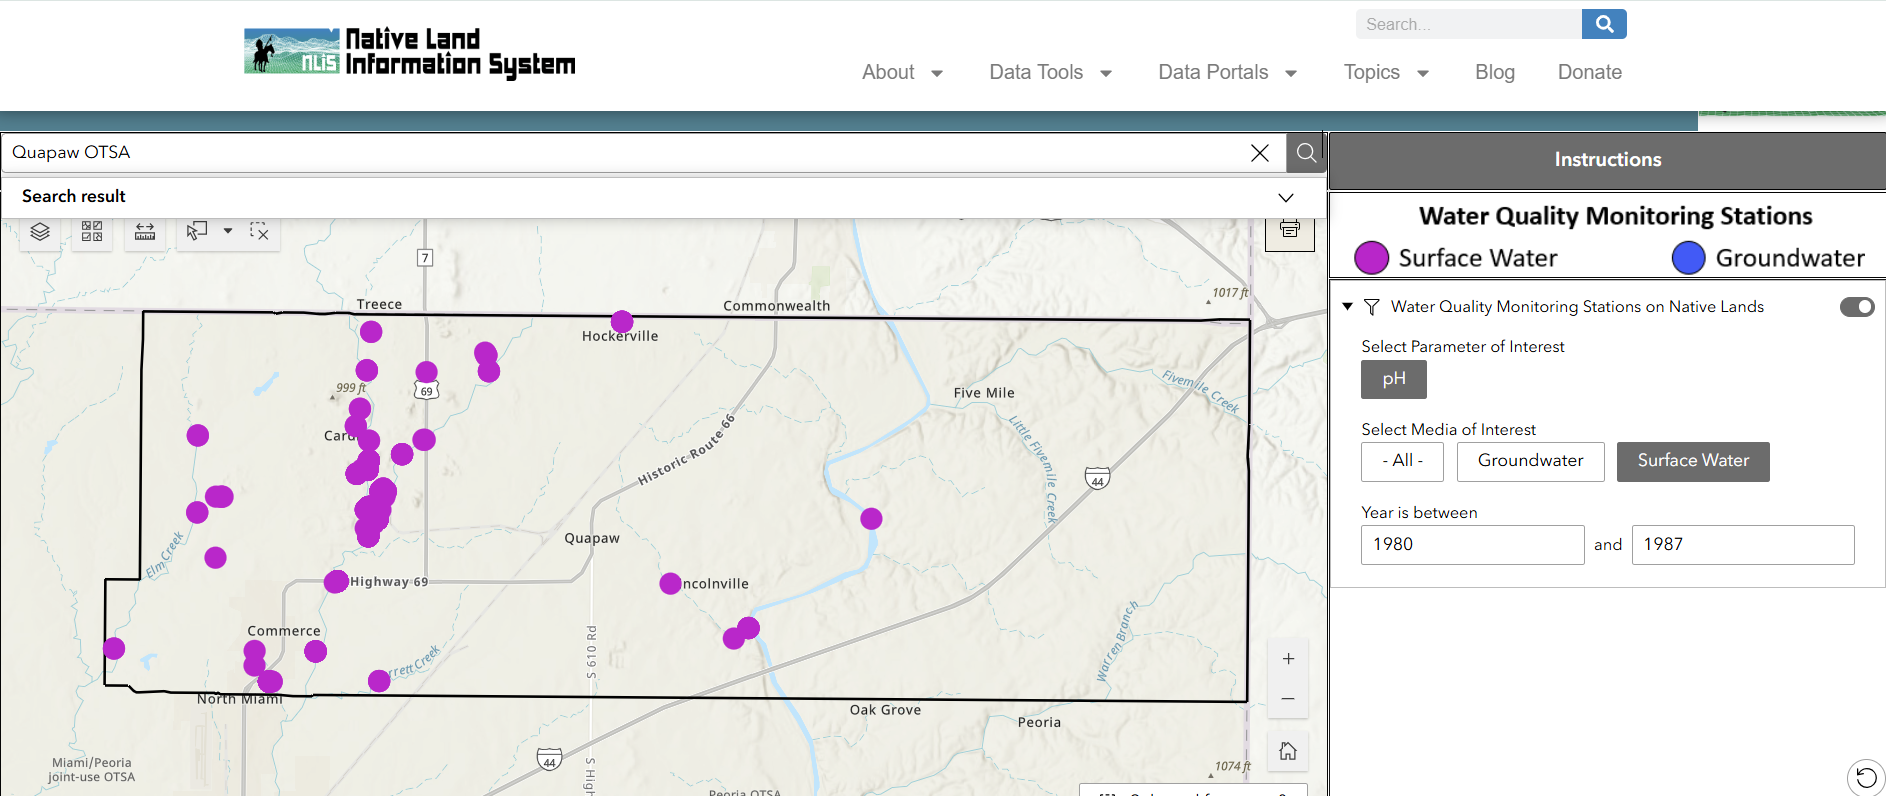
Water Quality Viewer - pH & Hypoxia
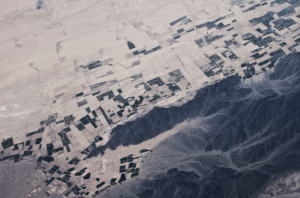
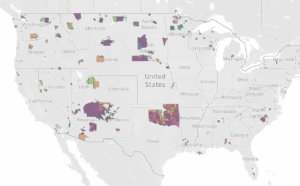
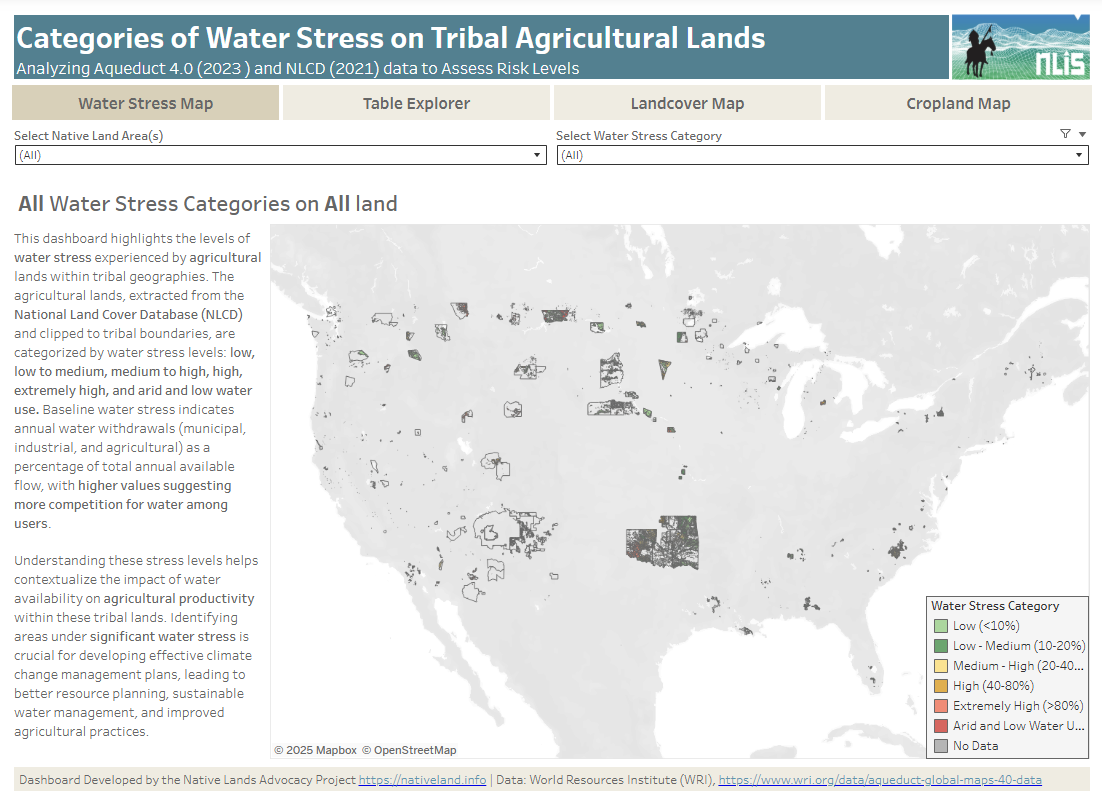
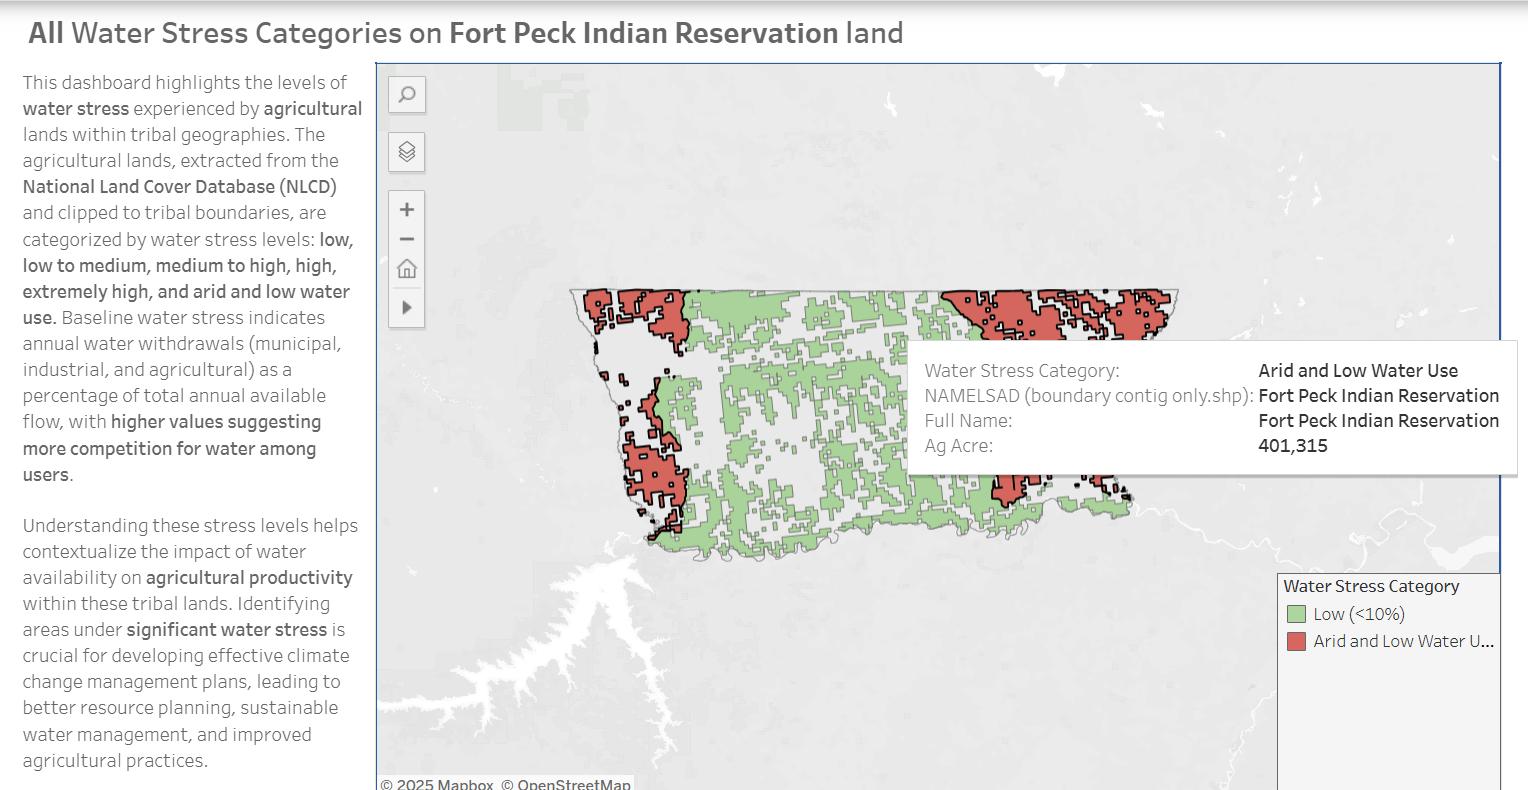
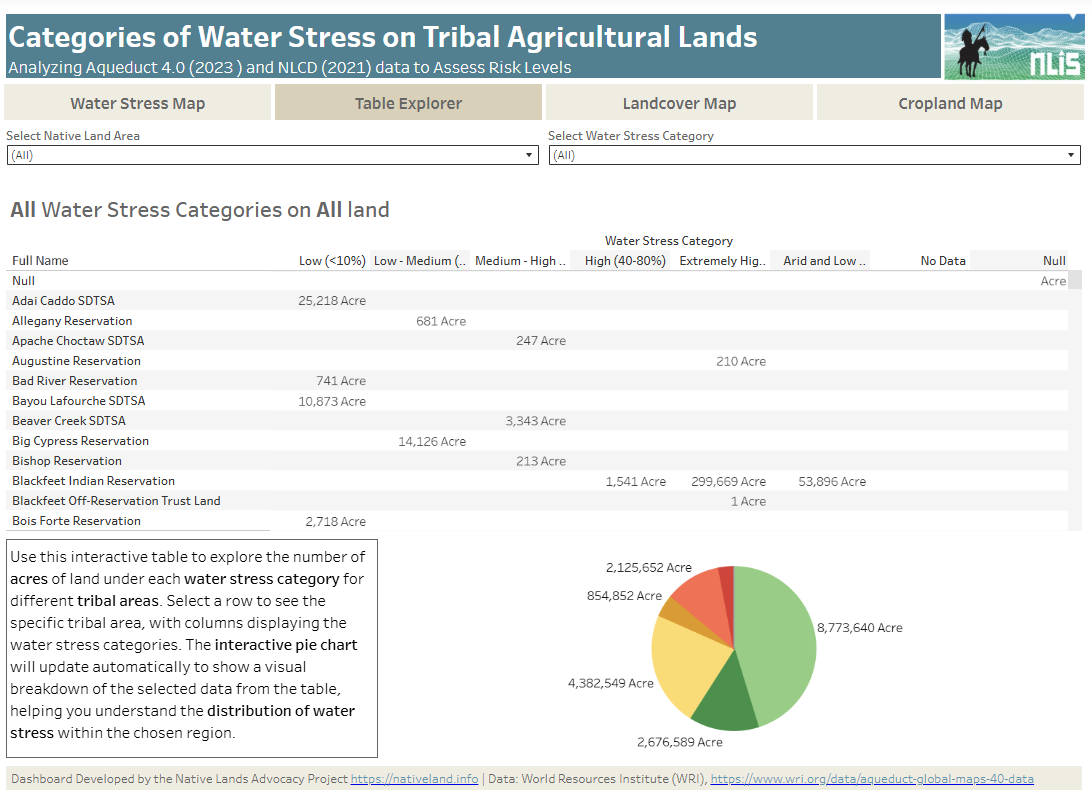
Agricultural Water Stress on Native Lands
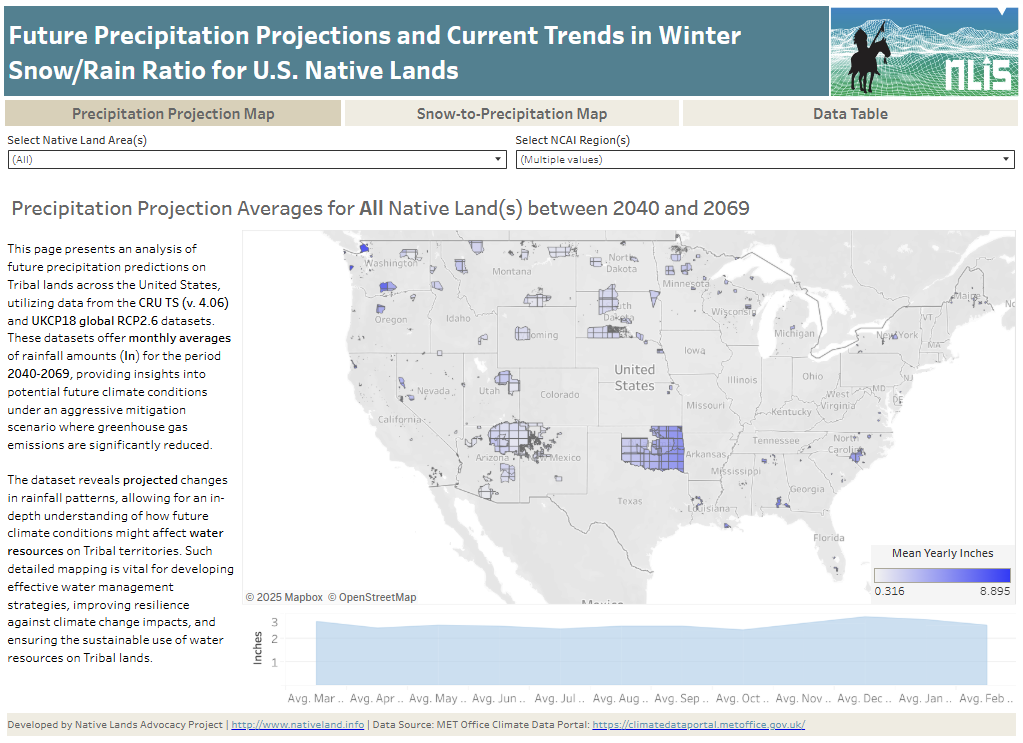
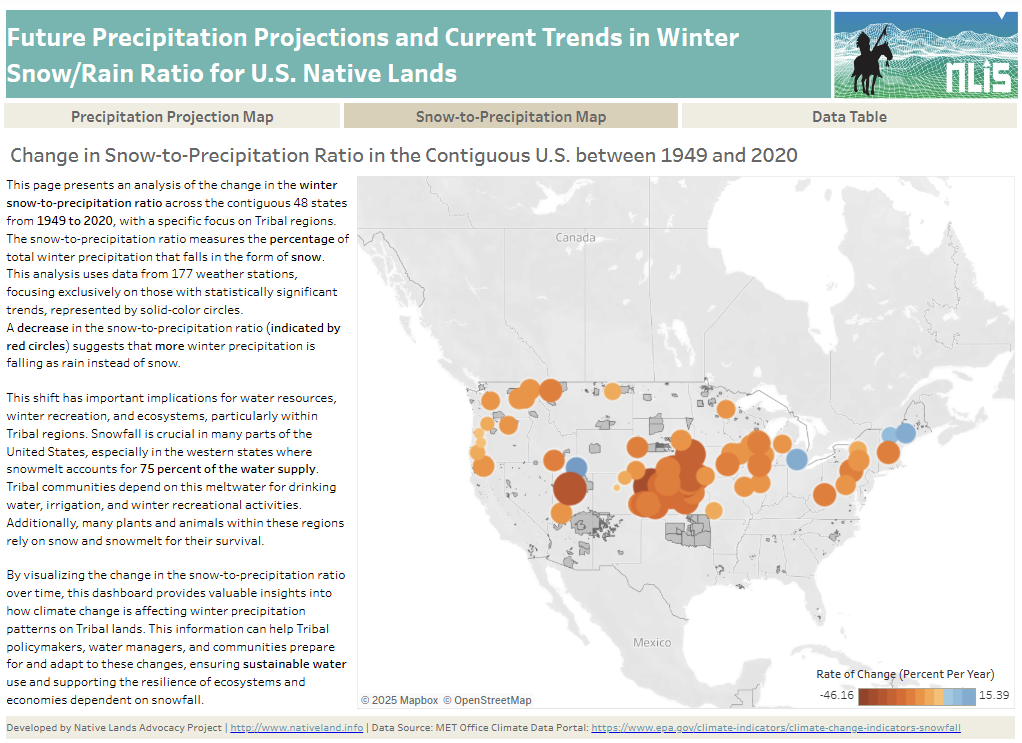
Precipitation Projections and Winter Trends on U.S. Native Lands
Rivers of Broken Promises: An Exploration of the Water Challenges Faced by Lakota Communities