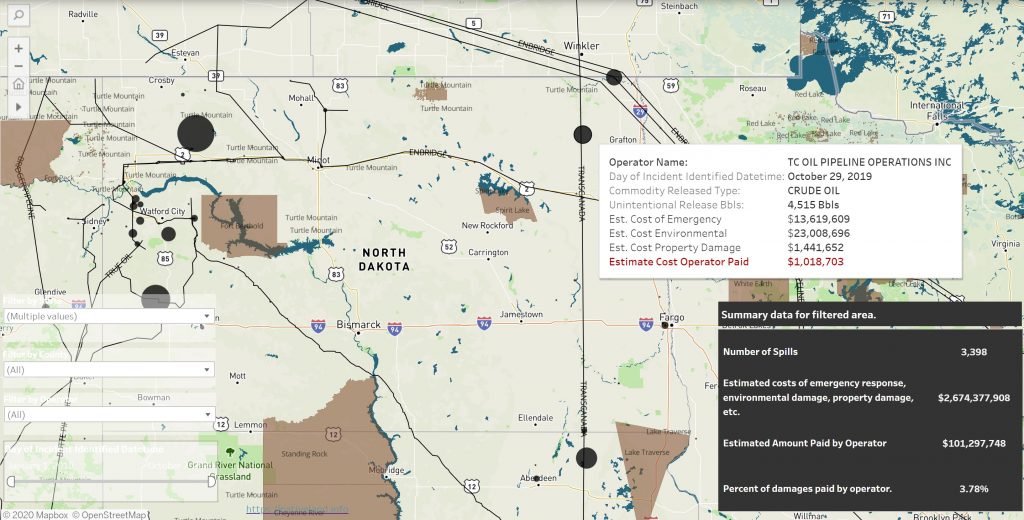
Today, the Native Land Information System launched a new interactive data visualization of US Hazardous Liquids Spills from 2010 to 2020. The viz draws on data from the US Department Transportation’s Pipeline and Hazardous Materials Safety Administration and displays 3,398 separate spills over a 10 year period or an average of 29 spills each month! The tool allows users to filter by date, county, state and operator and zoom to specific spills. Hovering over a spill with your mouse will open-up a box displaying the operator name, date of incident, commodity type released, volume released, and costs of emergency response, environmental remediation, and property damage as well as the amount operator paid. Nationwide these costs totaled $2.67 billion yet operators only paid $101 million or less than 3.8% of the costs.
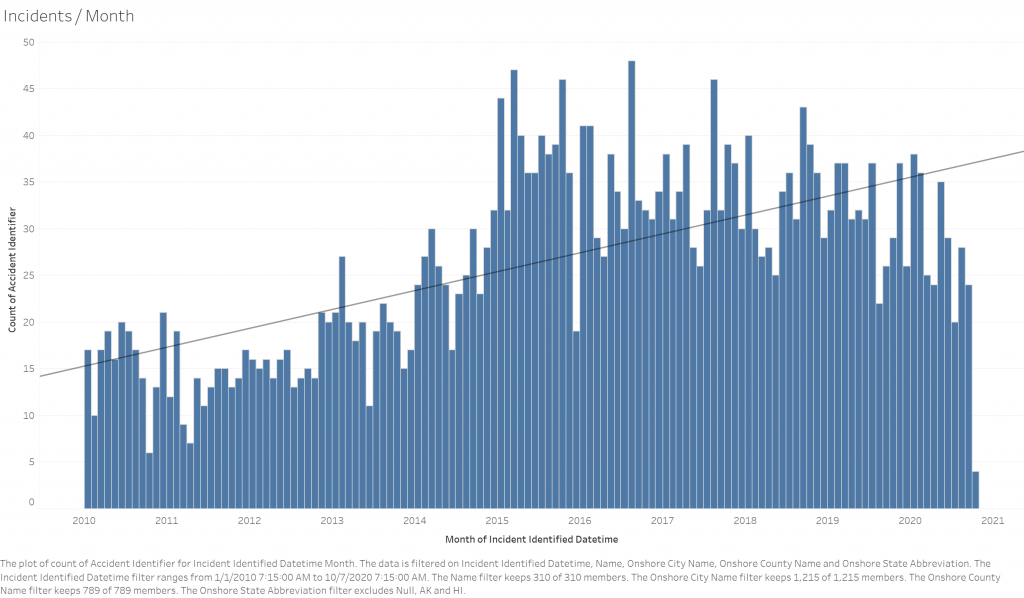
We also plotted the total number of incidents each month (below) which shows an increase in the number of monthly incidents from 2010 to 2020.
“Title 49 of the Code of Federal Regulations (49 CFR Parts 191, 195) requires pipeline operators to submit incident reports within 30 days of a pipeline incident or accident. The CFR defines accidents and incidents, as well as criteria for submitting reports to the Office of Pipeline Safety. The following kinds of information are collected:
- Key report information
- In-depth location information
- Facility information
- Operating information
- Drug and Alcohol information
- Cause of the accident/incident
The viz also includes a map of Crude Oil Pipelines obtained from the US Energy Information Administration and contemporary reservation boundaries obtained from the US Census Bureau included for reference purposes only.
The National Environmental Policy Act (NEPA) 42 U.S.C. §4321 et seq. (1969) as well as the International Labor Organization Convention (ILO) 169 and the UN Declaration on the Rights of Indigenous Peoples require the meaningful participation of indigenous communities when they may be affected by development activities. Specifically, the National Environmental Policy Act (NEPA) directs federal agencies to assess the potential environmental effects of their proposed major actions significantly affecting the human environment and inform the public about those potential effects.
This data visualization can be utilized by Tribes and the public to assess and raise awareness about the actual track record of producers.