
The Native Lands Advocacy Project (NLAP) was founded in 2019 to provide much-needed data support to Native American communities. As
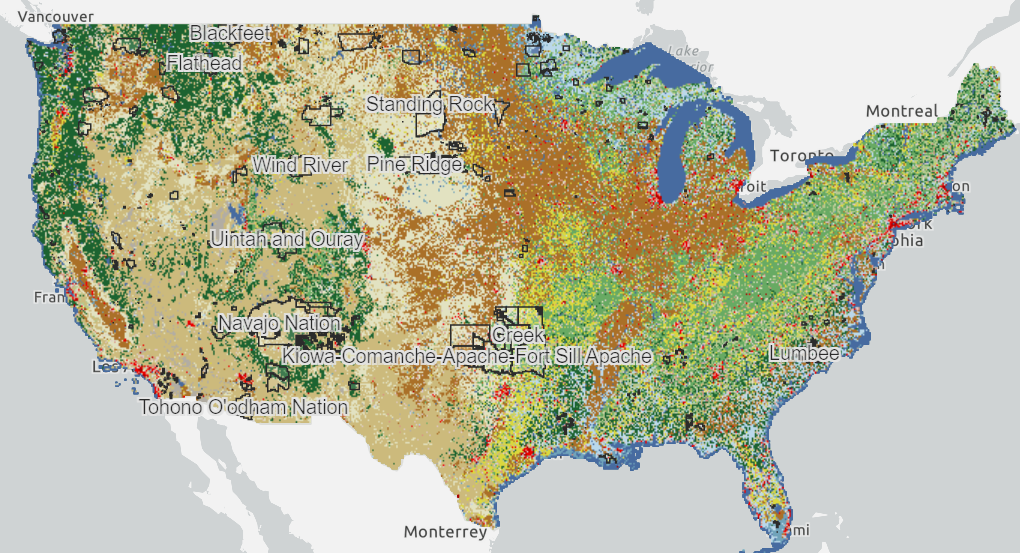
The Native Lands Advocacy Project (NLAP) compiles, consolidates, and visualizes data resources to support sovereign, sustainable, Native-led land planning and protection.

The Native peoples of North America have been caretakers of their lands and natural resources long before colonial contact, and

The Native Land Information System (NLIS) is home to over 120 public, free data tools and resources that were created
This month, the Native Lands Advocacy Project (NLAP) wrapped up our webinar series: Keystone Data Tools for Native Land Planning.

The Native Lands Advocacy Project (NLAP) is pleased to announce our new Sponsorship Program, which allows organizations to pledge funds
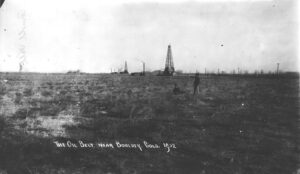
By calculating land dispossession, this report seeks to not only identify what has been taken from Native peoples but also how this theft became the original source of capital that built Colorado and the West.

The Native Lands Advocacy Project (NLAP) is hosting a webinar series on three of our key data tools. Join these

What climate concerns do tribes across the United States share? How do these climate concerns vary by region? Our Tribal Climate Literature Review identifies preliminary answers to these questions and provides insights to empower tribal climate planning.