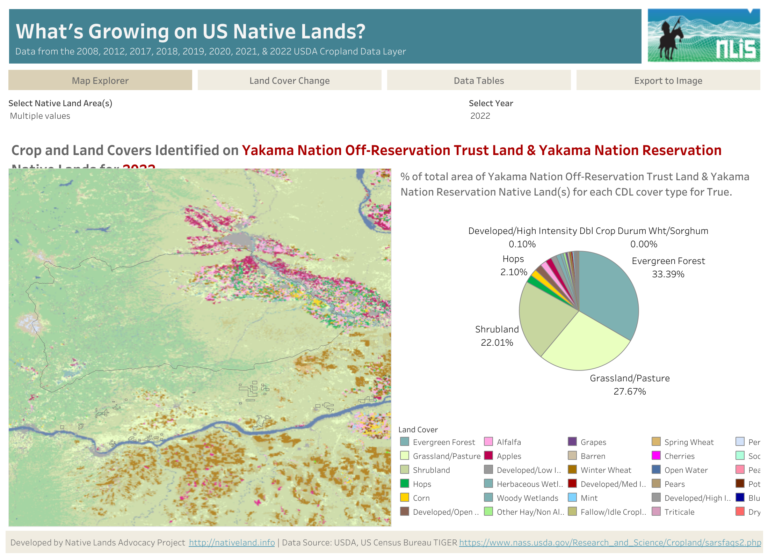
The Cropland Data Layer (CDL) Dashboard shows crop covers for 552 Native land areas in the coterminous United States. Because the data is gathered using satellite and groundwork, rather than self-reporting, the CDL provides an unprecedented, thorough look at what’s growing on US Native lands. Discover how to use this dashboard (and why this data is significant) below.
The Need for Accurate Cropland Data on Native lands
Today, the U.S. Department of Interior’s Bureau of Indian Affairs (BIA) holds 56.2 million acres of land in trust for various Native communities and individuals. Approximately 46 million acres (81%) of this trust land is used for farming and grazing, yet despite these vast resources, for at least the last 100 years, Native Americans have not been the primary beneficiaries of agriculture on their lands.
According to the 2012 USDA Census of Agriculture, Native American farmers and ranchers only captured 14% of the agricultural revenue generated on their lands. While Natives struggle with disproportionate levels of poverty, food scarcity, and food-related illnesses, the majority of their lands are being leased by the federal government to non-Natives.
In response, many Native communities have launched various initiatives to increase their utilization and control over their agricultural resources. However, a fundamental obstacle to these initiatives has been the lack of agriculture and land use information for their lands. In fact, the BIA does not make available to the public even basic statistics about its agricultural leasing programs or land ownership data on Native lands.
Furthermore, while the federal government produces a great deal of agriculture information at the county and state levels, they often neglect to collect and/or format this data for Native lands, which can and often do overlap state and county boundaries. For example, the federal government has been collecting agriculture census data for every county in the United States since 1840, but it wasn’t until 2012 that they began to collect data in earnest for a select number of Native reservations. While this demonstrates progress, there are still numerous datasets that need to be formatted to calculate data for Native lands.
The Cropland Data Layer on Native Lands
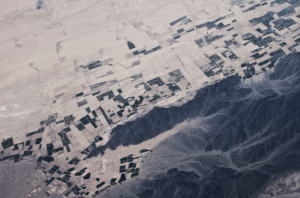
One of the largest and most useful datasets that can be used for Native land data is the USDA’s Cropland Data Layer (CDL). According to the USDA, the Cropland Data Layer is a “raster, geo-referenced, crop-specific land cover data layer created annually for the continental United States. The CDL is created using moderate-resolution satellite imagery and extensive agricultural ground truthing. The purpose of the Cropland Data Layer program is to use satellite imagery to provide acreage estimates to the Agricultural Statistics Board for major commodities and to produce digital, crop-specific, categorized geo-referenced output products.”
The CDL’s data has been collected since 1997, making it an excellent tool for analyzing long-term land cover trends. The 2019 data includes 130 categories ranging from specific types of crops, pasturelands, developed lands, wetlands, etc. Citing NRCS (2016) metadata, Lark et al. (2017) state, “the CDL covers the conterminous 48 states with field-level resolution and crop classification accuracies typically upwards of 90% for major commodities like corn, cotton, rice, soybeans, and wheat.” The Cropland Data Layer has been used in hundreds of studies on a range of topics, including agriculture productivity, crop variability, impacts of climate change, climate resiliency studies, estimates of carrying capacity, and more.
The CDL is important because it provides a comparative database of agriculture across the coterminous United States and across a rather long period of time. This is different than the USDA Census of Agriculture, which depends on self-reported numbers and only includes a small fraction of Native American lands.
Limitations of the CDL
While the CDL provides a seamless coast-to-coast accounting of land cover, it’s important to consider that the resolution of each pixel (the basic unit of analysis for the CDL) is the equivalent of 30m x 30m on the ground. This means that crops or covers that are smaller than that area will not be accurately classified. Because of this, the CDL is great for measuring large-scale mono-cropped agriculture and not so great at measuring small-scale sustainable agriculture, where it’s common to have a mixture of crops growing in a small area.
What questions can you answer with the NLIS CDL Dashboard?
- What crops are growing on my reservation?
- How much land is utilized for each crop cover?
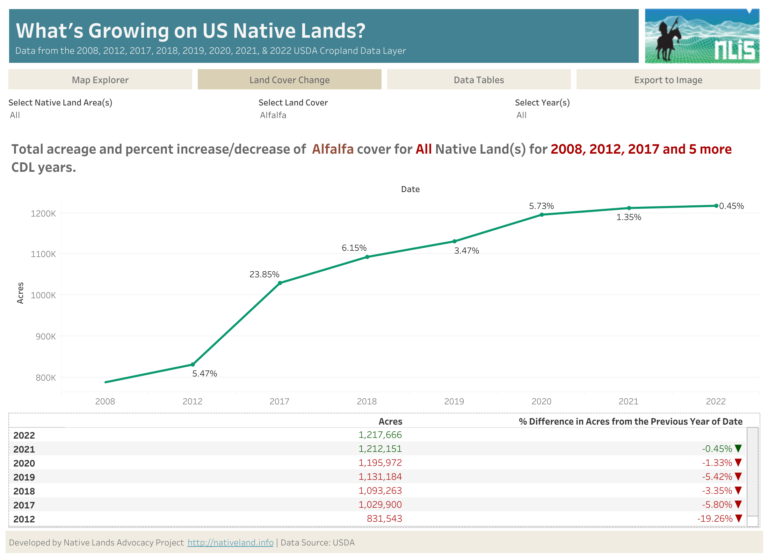
- How has the crop cover changed from 2008 to today?
- Where are different crops grown?