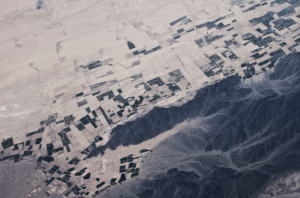
According to the NLIS’s National Land Cover Database dashboard, in 2019, there were approximately 26 million acres of rangeland within Native American reservations and off-reservation trust lands. Now, say that you are a Tribal natural resource manager, an established rancher, or land owner—it is no secret that adequately monitoring this vast land base, whether owner-managed or leased, can be difficult, especially with already limited time and resources. Even for Tribal communities who might have their own in-house GIS team, obtaining and updating reliable data on rangeland health for tens, hundreds, thousands or even millions of acres requires an entire team of trained GIS and field data collection professionals!
… At least that was how it used to be.
Now, with a simple internet connection and a few clicks of a mouse, the web-based Rangeland Analysis Platform (‘RAP’ for short) makes it possible to access and analyze over 36 years of satellite-derived vegetation cover and the rangeland production data. Even better, it automatically updates every sixteen days as the new satellite data is collected. Now of course, the RAP will not replace your existing rangeland professionals, but it will sure make their job a whole lot easier!
It's like being in a candy store! We are relatively new to this pasture, [the RAP] allows us to see how the forage cover was in previous years and use that historic information as a baseline to compare the current growth.
Lucille Contreras, Texas Tribal Buffalo Project www.texastribalbuffaloproject.org
We asked Lucille Contreras, member of the Lipan Apache tribe and CEO and Founder of the Texas Tribal Buffalo Project, her first impressions of the RAP, and she offered, “It’s like being in a candy store! We are relatively new to this pasture, [the RAP] allows us to see how the forage cover was in previous years and use that historic information as a baseline to compare the current growth.”
As part of our effort to assist Tribes in the protection and management of their lands (along with developing our own data tools), the Native Lands Advocacy Project is also committed to researching and raising awareness about third-party tools, like the RAP. In this post, we hope to summarize the data behind RAP, its various tools, and how Tribes might utilize the RAP for their own lands.
What is the 'RAP'?
The Rangeland Analysis Platform (RAP) was developed in partnership with the USDA Natural Resources Conservation Service, Bureau of Land Management, and the University of Montana for the purpose of mapping vegetation across the United States and providing users with an innovative and efficient way to interact with rangeland data. RAP is co-authored and supported by rangeland ecologists Brady Allred and Jeremy Maestas, research scientist Matthew Jones, and RAP outreach coordinator Eric Jensen.
“Fast, powerful, and free, the Rangeland Analysis Platform is an innovative online tool that quickly visualizes and analyzes vegetation data for the United States… The Rangeland Analysis Platform combines satellite imagery with thousands of on-the-ground vegetation measurements collected by the Bureau of Land Management, the National Park Service, and the Natural Resource Conservation Service. The power of cloud computing and machine learning technology allows the RAP to easily map vegetation across the United States.”
- rangelands.app
Additionally, when it comes to effective rangeland monitoring, it is important to keep it simple—and that is why the co-authors of the platform built the RAP web application. RAP is built upon the Google Earth Engine and provides several interactive web applications for users to compile and visualize the vast amount of rangelands data that is hosted within RAP’s datasets—uncomplicating the process of monitoring rangelands across greater space and time.
"[The goal was to] make [RAP] very accessible to people, whether you're a land manager, or whether you're a rancher that spends almost no time on your computer—except in the evenings when you're coming in after being out all day on the ranch… to have that rancher still have the ability to get on this website and have a real quick method to have a look at their ranch through time… that was the goal."
Matt Jones (The Art of Range Podcast, 2019)
Our team was able to meet with Eric Jensen, a Data Applications Coordinator at the University of Montana and Outreach Coordinator for the RAP, to discuss the history and notable aspects of the platform. With the rise of cloud computing, the RAP team was able to combine local, “on the ground” datasets with satellite imagery to produce maps of rangeland cover and vegetation across the entire continental United States. Notably, these maps are available at a spatial resolution of approximately 30×30 meters and provide rangeland data dating back to as early as 1986!
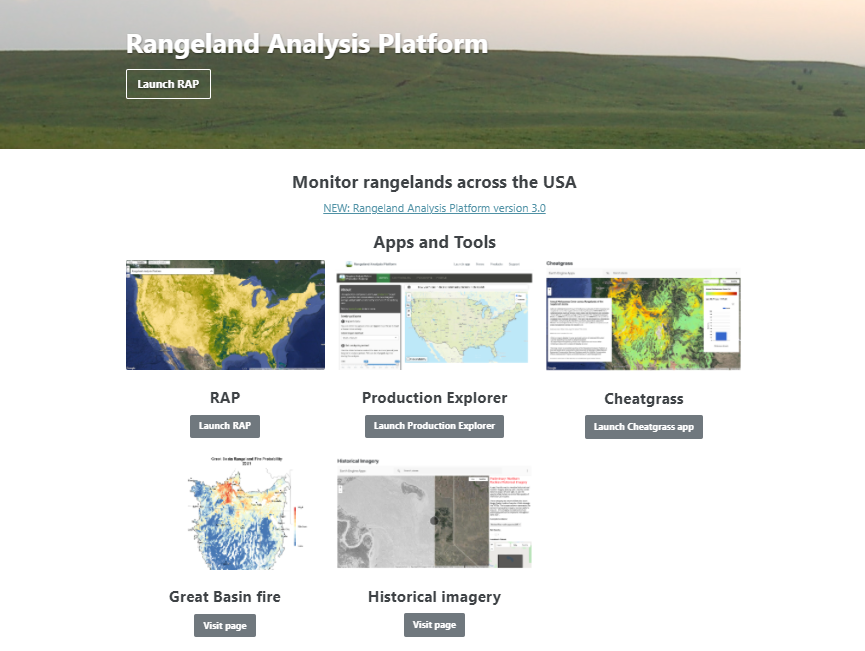
According to Jensen, the two primary components of the platform are their rangeland datasets and the RAP website application which enables end users to query and visualize the data. It is also important to note that the RAP provides other supporting tools that enhance observation of the data hosted within the main RAP application: the Production Explorer application, Cheatgrass application, Great Basin Fire Probability page, and Historical Imagery page.
Overview of the RAP's Tools & Their Potential for Native Nations
Jensen expressed with regard to Tribes “Having [a dataset] that is consistent across Tribal nations is gonna be really useful… especially when you are looking at grazing, grazing through time, and rangeland productivity.“
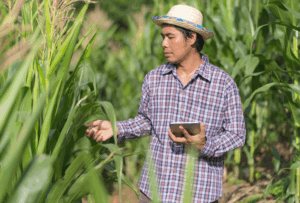
Additionally, Jensen shared “We [RAP team] really encourage people to utilize our remotely-sensed data sets, but to validate those data sets with local knowledge and local data. At the same time, one of the really valuable aspects to utilizing the RAP is the ability [for local communities] to have another data set that is consistent, and where you don’t have to go into the field to collect anything.” Therefore, as NLAP continues to work with different tribal communities, we are encouraged by the possibility of Tribes utilizing RAP in conjunction with their local knowledge to validate the data necessary to protect and maintain their homelands.
We [RAP team] really encourage people to utilize our remotely-sensed data sets, but to validate those data sets with local knowledge and local data. At the same time, one of the really valuable aspects to utilizing the RAP is the ability [for local communities] to have another data set that is consistent, and where you don’t have to go into the field to collect anything.
Eric Jensen, RAP Outreach Coordinator
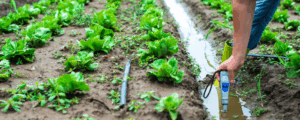
"Managing land for livestock and wildlife requires understanding how vegetation responds to human- or natural-caused changes through time, such as drought, irrigation, grazing, or wildfire. Information available through RAP can help landowners, managers, or conservationists sustain valuable water and soil resources, improve forage for livestock and wildlife, or manage weeds and wildfires. This online app is designed to be used in conjunction with on-the-ground data and site-specific knowledge."
- RAP User Guide, 2018
The five apps and tools that comprise the RAP include its primary datasets—vegetation cover dataset and production dataset—and its supporting tools of the Production Explorer, Cheatgrass analysis, Great Basin rangeland fire probability, and the historical imagery page. Here is an overview of each RAP tool and how Tribes might utilize each one:
Vegetation & Production Cover Datasets
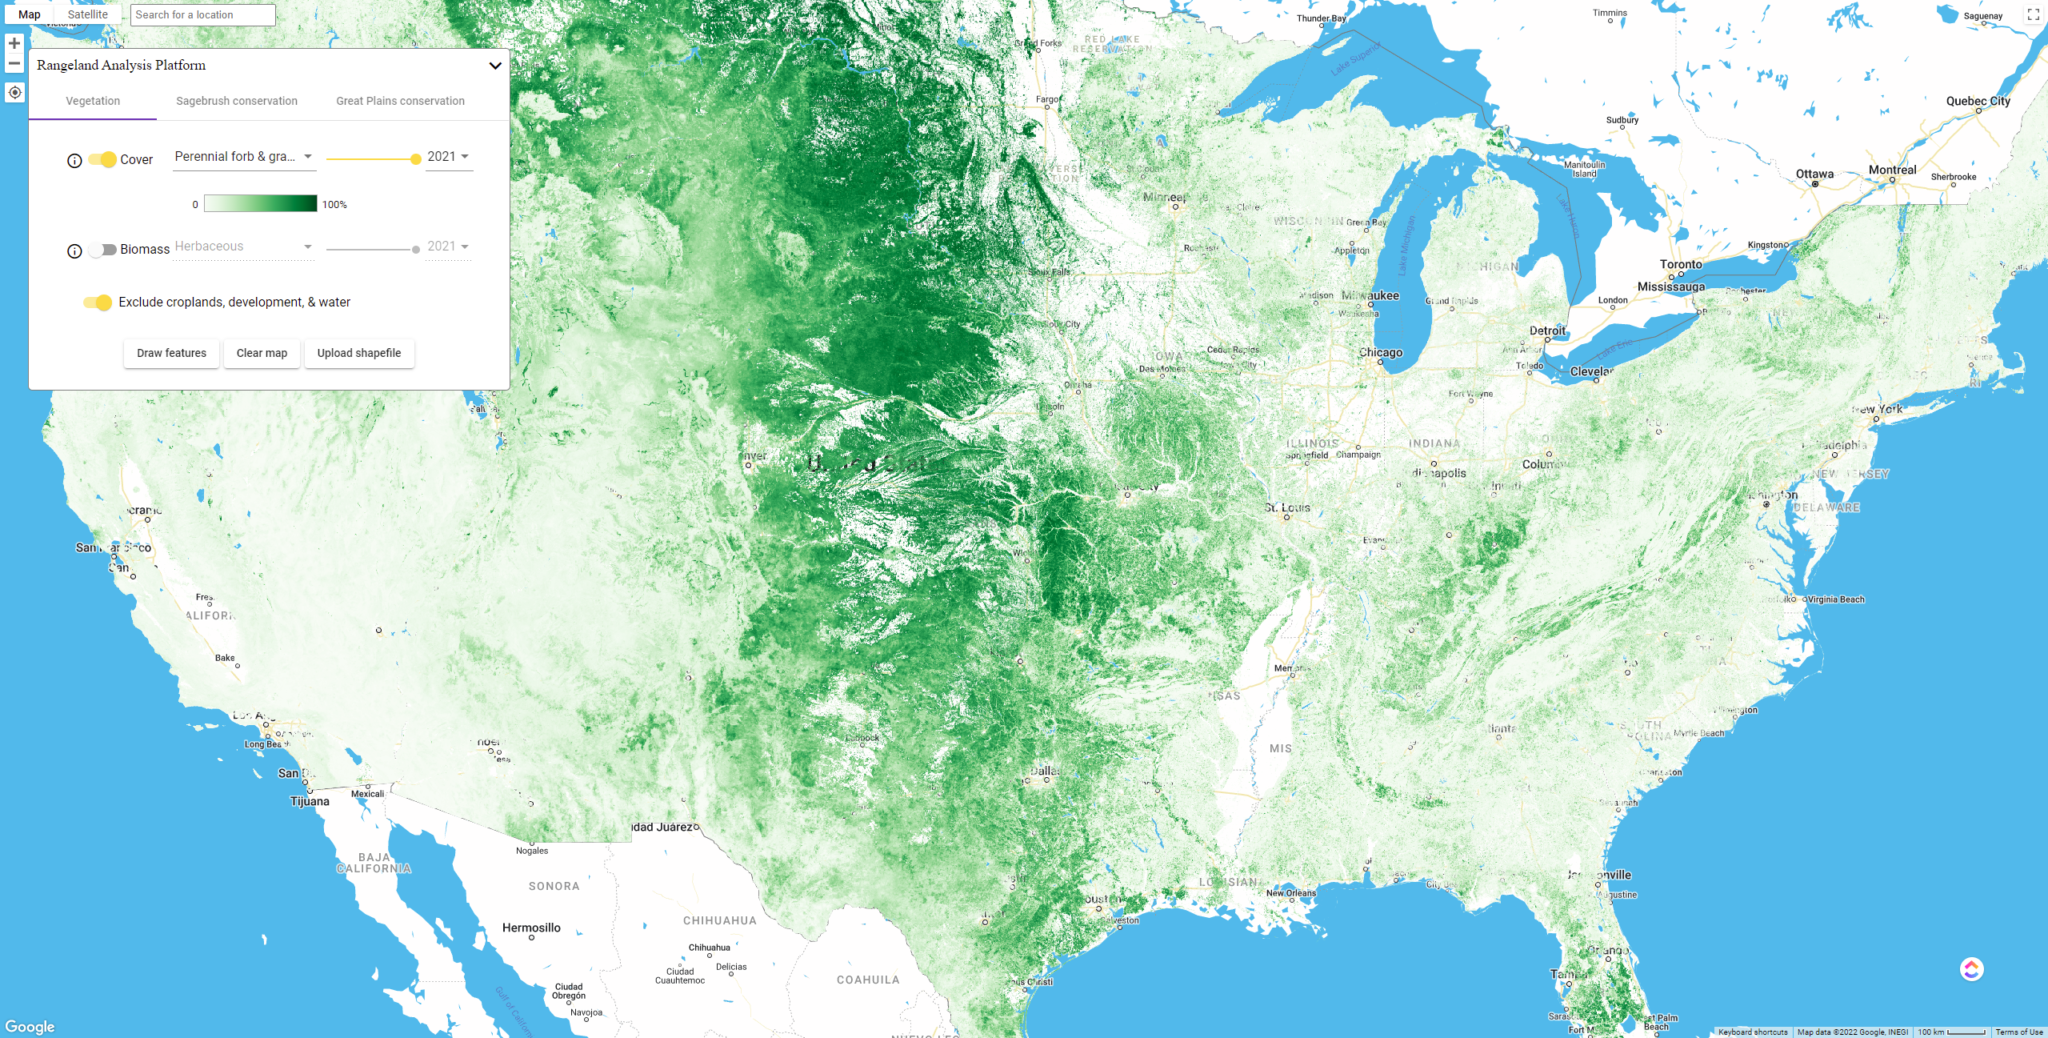
The RAP’s primary datasets measure rangeland vegetation cover and the rangeland production “from the Great Plains all the way to the Pacific Coast” (The Art of Range Podcast, 2019). The Vegetation Cover dataset is an estimate of rangeland cover over five common vegetation classes and is available in annual timesteps. With data going back to 1986 and updating every 16 days, the RAP provides a map of perennial and annual forbs and grasses, shrubs, trees, and bare ground, making it possible to visualize and quantify nearly 40 years of change in the land cover types. Further, the Production dataset is an estimate of total rangeland production—estimating herbaceous forage in lbs/acre in both annual and 16-day timesteps.
Data Source: Sourced from LandSAT satellite imagery combined with data collected by Bureau of Land Management’s Assessment, Inventory, and Monitoring Strategy; National Park Service Northern Colorado Plateau Inventory & Monitoring Network; and National Resources Conservation Service National Resources Inventory.
Time-Step: Updates annually and every 16 days, and hosts rangeland data dating back to 1986.
Potential Use-Cases for Tribes:
- Monitor overgrazing
- Monitor key biodiversity areas for Tribal climate planning
- Observe how production has changed within the current growing season or over multiple years
- Utilizing the 16-day timestep in the Production dataset, Tribes can analyze the growth curve of their rangeland production & track near real-time production
- View the gap between potential production and actual production to potentially inform management practices that can help “close the gap” and prevent loss of revenue
Production Explorer

The Production Explorer is an additional tool of the RAP that provides a more in-depth analysis of the rangeland production data hosted in the main RAP application. The data hosted within this tool is not mapped, but rather provides an analysis of trends summarized for current rangeland production, historical production, and stocking rate estimates. These three main calculations of the Production Explorer are incredibly valuable, and we will go into depth on each calculation by using Custer State Park in South Dakota as an example below.
You can also launch the Production Explorer on our website! With permission from the RAP Team, we are able to embed the Production Explorer into the Native Land Information System (NLIS)!
Data Source: Sourced from RAP production cover data.
Time-Step: Annual
Potential Use-Cases for Tribes:
- Compare current year production with previous years of production
- Evaluate productivity departures from historic averages
- Estimate stocking rates on an annual basis
- Export this specified data into an excel spreadsheet to use in your Tribe’s own natural resource planning
What to Expect from the RAP's Production Explorer
Below are some sample outputs from the Rangeland Analysis Platform’s Current Production, Historic Production and Stocking Rate Tools. To generate these sample calculations, we used a boundary shapefile of Custer State Park obtained from South Dakota’s Open Data Portal. The calculations were performed on March 12th, 2022, and according to the site summary, the most recent data for this period was March 5th. The RAP sums all grasslands within the area of interest and excludes forested areas, waterbodies, developed areas, and croplands from the totals.
Current Production Outputs from RAP
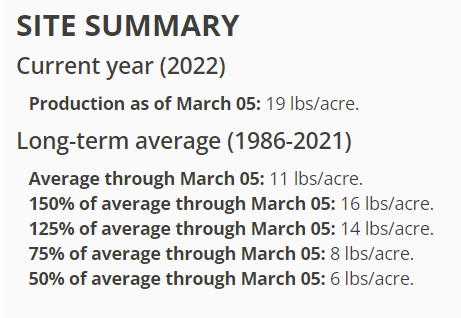
The Site Summary
Displays a quick snapshot of the current year's production (in lbs per acre of forage cover) as of the last available date of Landsat (updated every 16 days). It also shows users how the current production compares to the long-term data, which is in this case from 1986-2021.
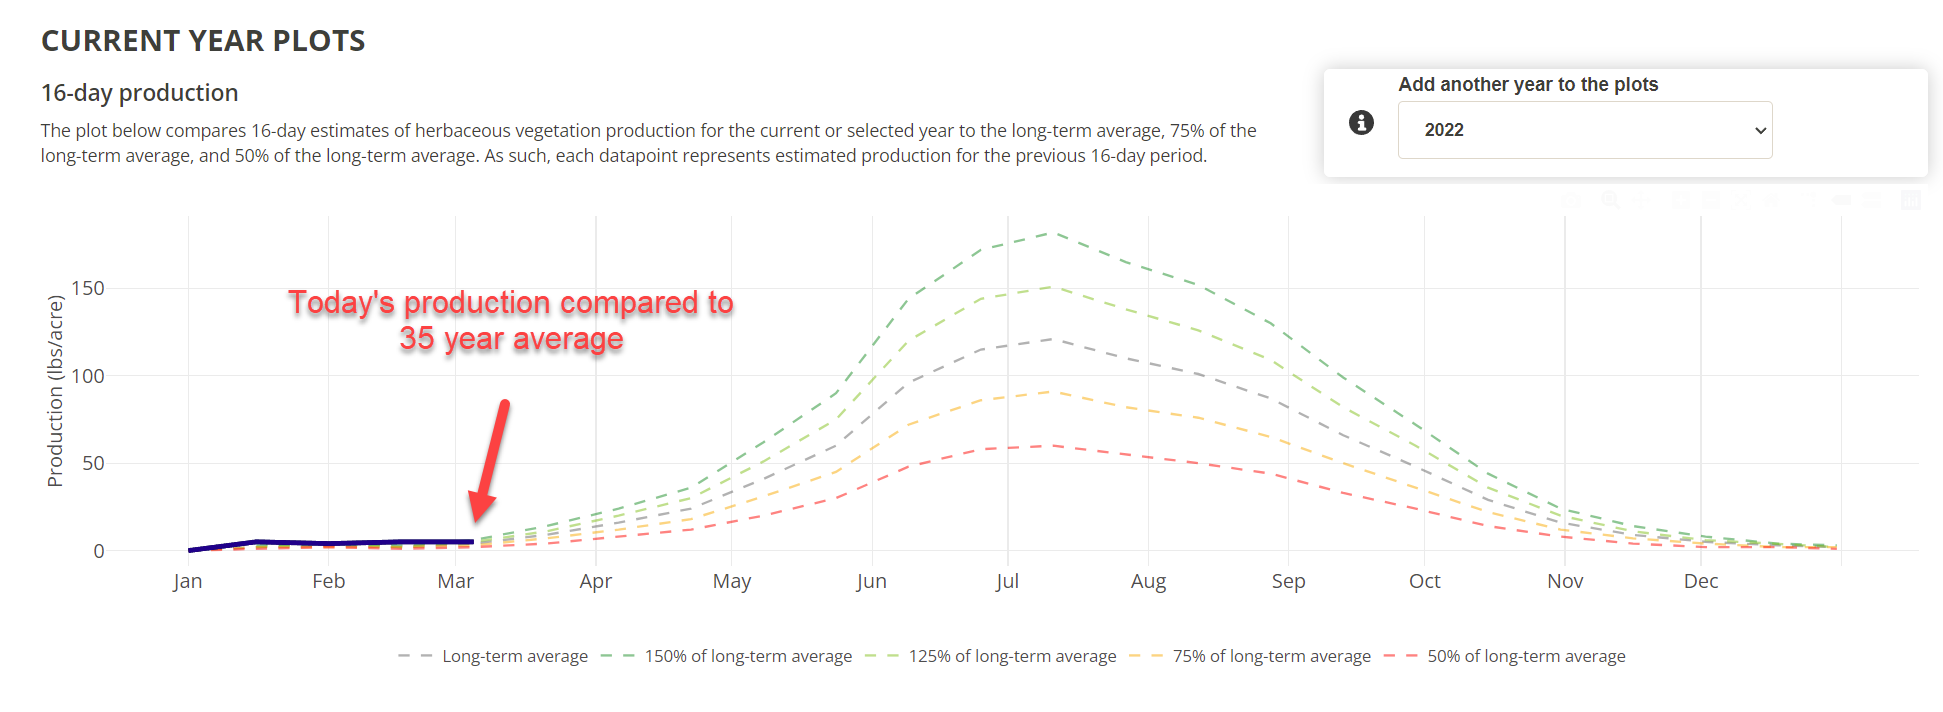
The Current Year Plots
Shows graphically how the current production compares to the 35-year average, where current production is visualized as dark blue and long-term average visualized as grey. Also shows comparisons from either 150% above average to 50% (below average).
Historical Production Outputs from RAP

The Site Summary
Displays a quick snapshot of historical production (in lbs per acre of forage cover) over long-term averages dating back to 1986. The summary also provides soil survey estimates from normal, to favorable, and to unfavorable.
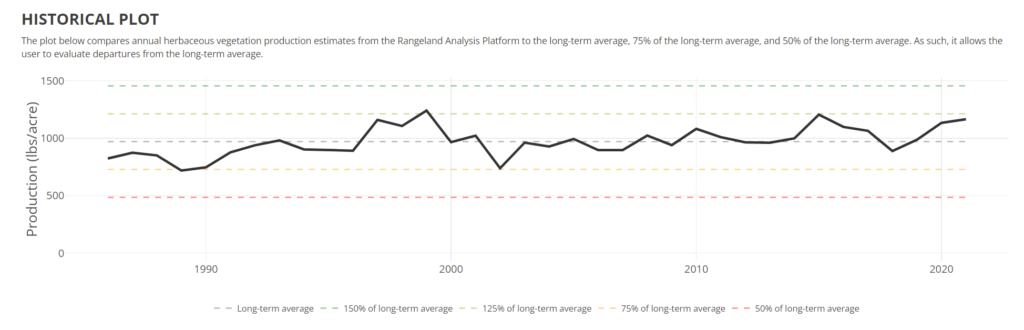
The Historical Plots
Shows graphically how production has shifted historically since 1986 to present day, allowing users to evaluate historic departures from the long-term average (the grey dotted line). Additionally compares annual, historical production estimates from 150% above average and 50% of the long-term average.
Stocking Rate Estimates from RAP
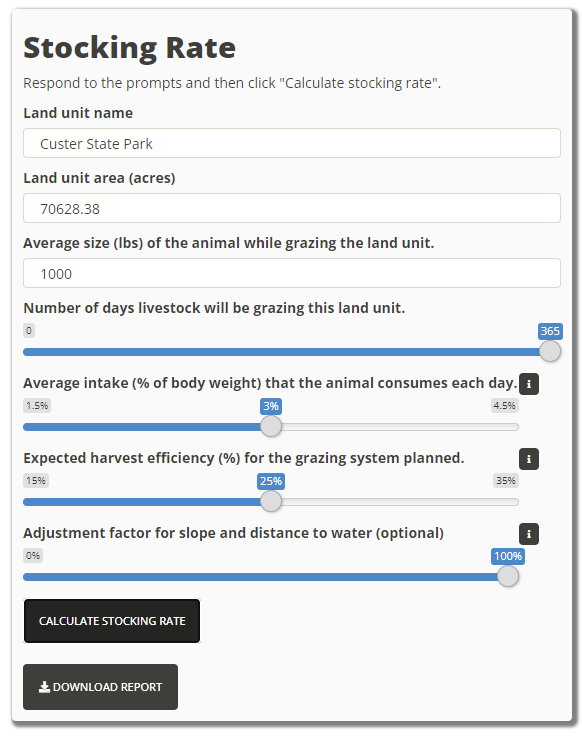
Stocking Rate Inputs
Displays how to input user-defined stocking information into the RAP stocking rate tool to produce stocking and production rate estimates.
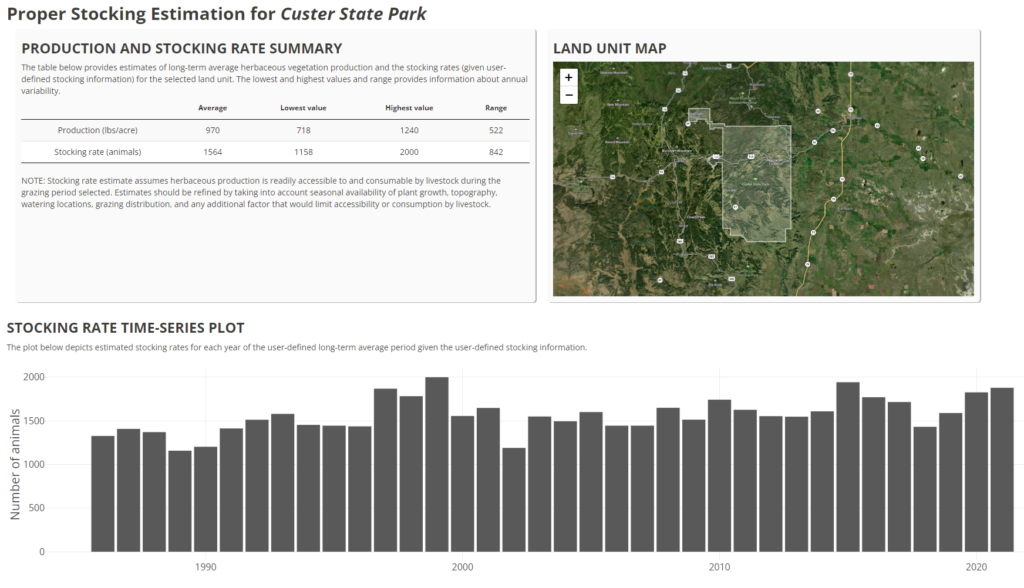
Stocking Rate Outputs (Estimates)
Displays a summary of stocking rate and production rate estimates based on the previously inputted data for Custer State Park. Also graphically displays estimated stocking rates for each year of the user-defined long-term average period and user-defined stocking information.
Cheatgrass Analysis

The Cheatgrass supporting dataset provides an estimated percent cover of herbaceous annuals at 30m resolution on rangelands across the sagebrush biome during the period 2016-2018.
Data Source: These datasets are a weighted average of three sources; the Rangeland Analysis Platform, USGS-Harmonized Landsat Sentinel, and USGS-National Land Cover Database. This layer was developed by a cheatgrass committee convened by the Western Governors Association-appointed Western Invasive Species Council as part of a new toolkit for invasive annual grass management across the western U.S.
Time-Step: Provides annual estimates for the period of 2016-2018
Potential Use-Cases for Tribes:
- Monitor and mitigate the impacts of invasive plant species
- Identify core areas within the reservation that are unaffected by invasive annual grasses
- Inform Tribal natural resource restoration programs and help those programs better understand management of pasture when combined with their own local data (i.e. creating or reforming an herbicide program to monitor cheatgrass)
Great Basin Fire Probability

The Great Basin Fire Page utilizes RAP data to estimate fire probability in the Great Basin region. The map shown above demonstrates where large fires (>1,000 acres) are most likely to occur throughout the year given an ignition.
Data Source: Map estimates are calculated using RAP biomass data, rangeland cover data, and various climate/drought indices.
Time-Step: Map provides probabilities for the entire year or fire season and hosts this data dating back to as early as 1988; Maps are available in early March.
Potential Use-Cases for Tribes:
- Compare current fire season to the last fire season
- Gain a better understanding of pre-fire conditions for the Great Basin region to potentially improve post-fire treatment plans
- Monitor outcomes of post-fire rehabilitation efforts
Historical Imagery

The Historical Imagery page allows users to analyze and compare tree cover—going back to the 1940s, 1950s, and 1970s— for the states of Montana, Wyoming, and Idaho. RAP is currently working on expanding this dataset across the Western region.
Data Source: Sourced from the United States Geological Survey Single Frame Archive from the 1940s through the 1970s.
Time-Step: Annual
Potential Use-Cases for Tribes:
- Compare current vegetation, streams, and other landforms to nearly 60 years of historical imagery
- Better understand relatively long-term changes like erosion, river meanders, desertification, deforestation, etc.
- Monitor human-caused change in infrastructure, buildings, roads, urbanization, wells, etc
NLAP encourages anyone interested in the RAP to get online and give it a try! We believe when combined with sufficient local knowledge, the RAP can be a powerful tool for maintaining healthy homelands and planning for the future.
For more information on how to navigate the RAP, please visit rangelands.app or visit the Rangeland Analysis Platform’s Youtube Channel for step-by-step tutorials of each of the RAP’s datasets and more!