Understanding Wind Speed on Native Lands

Wind plays a significant role in shaping ecosystems, affecting infrastructure planning, and in overall renewable energy potential. Recognizing this, the Native Lands Advocacy Project (NLAP) developed an Average Wind Speed data dashboard as part of our Climate Data Portal for U.S. Native Lands. Read on to learn more about this dashboard and explore two potential […]
Understanding the 2026 Federal Budget for Indian Country

Here’s what we currently know about proposed funding levels for the BIA, BIE, and BTFA as of September 30, 2025.
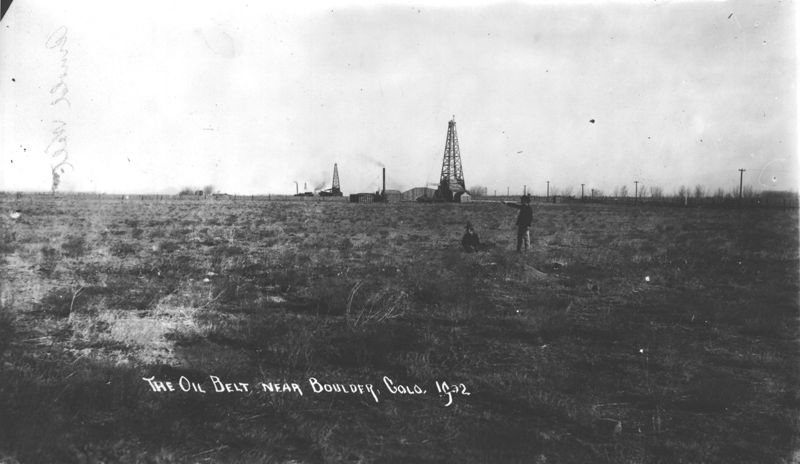
Creating a Historic Loss Assessment, Part 4: Extermination of buffalo and other significant losses
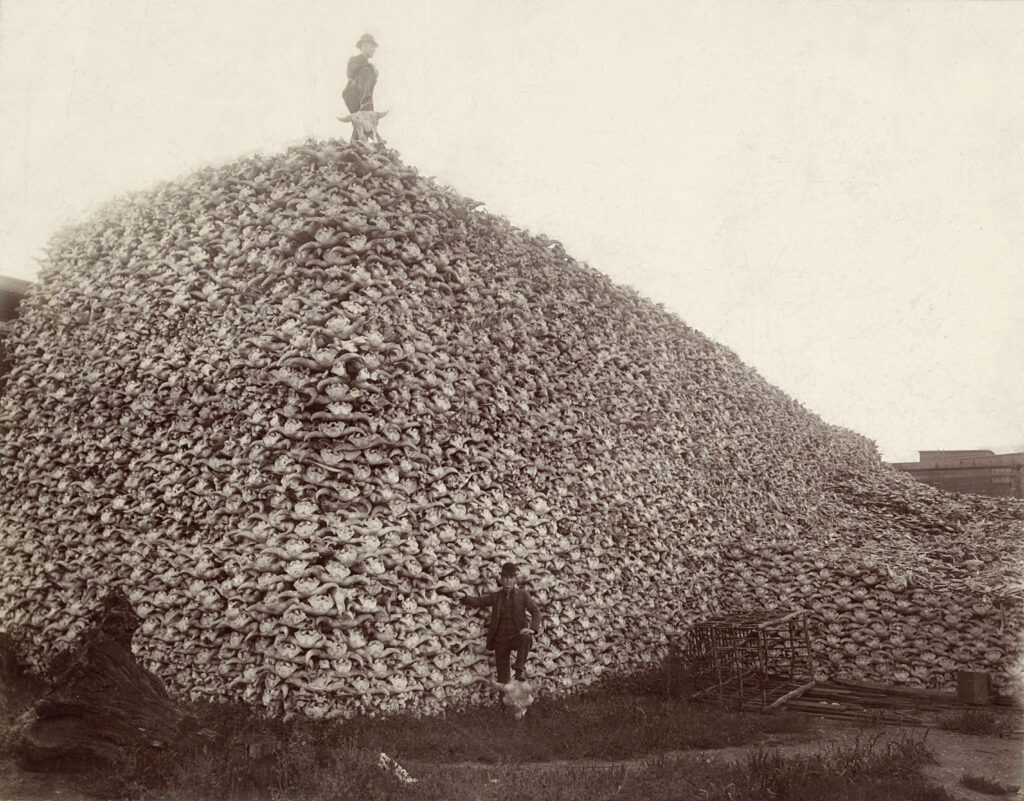
By calculating land dispossession, this report seeks to not only identify what has been taken from Native peoples but also how this theft became the original source of capital that built Colorado and the West.
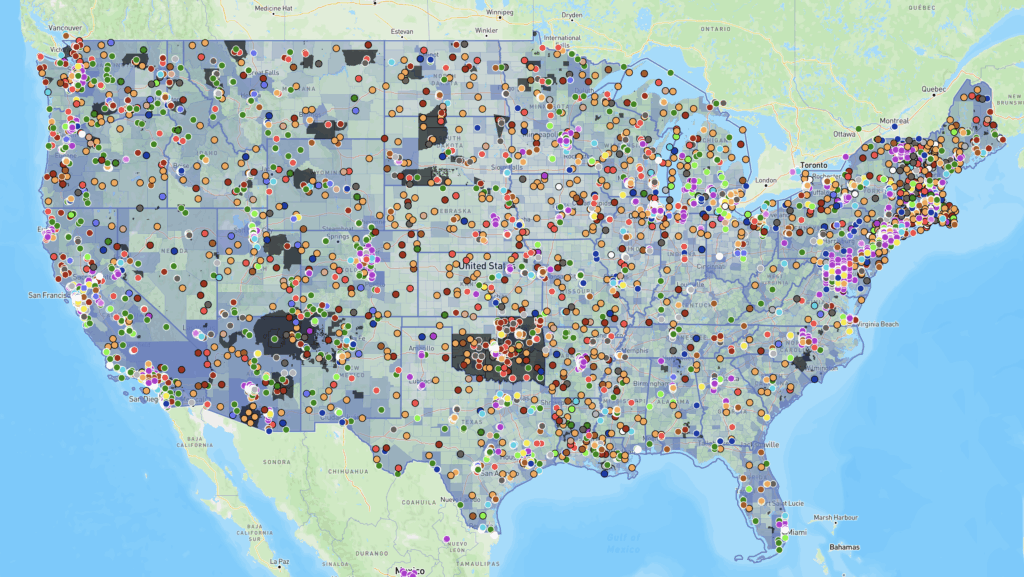
New Storymap: Visualizing Federal Spending in Indian Country
Learn about three new data tools that allow users to access relevant data about federal investments in Indian Country.
Visualizing Federal Spending in Indian Country

The Native Lands Advocacy Project recently published three data dashboards that focus on federal spending as it relates to tribes.
The Impact Project Maps the Effects of Federal Changes on Local Communities
The Impact Project helps equip tribes with relevant information about the real-time effects of federal policy changes on local communities.
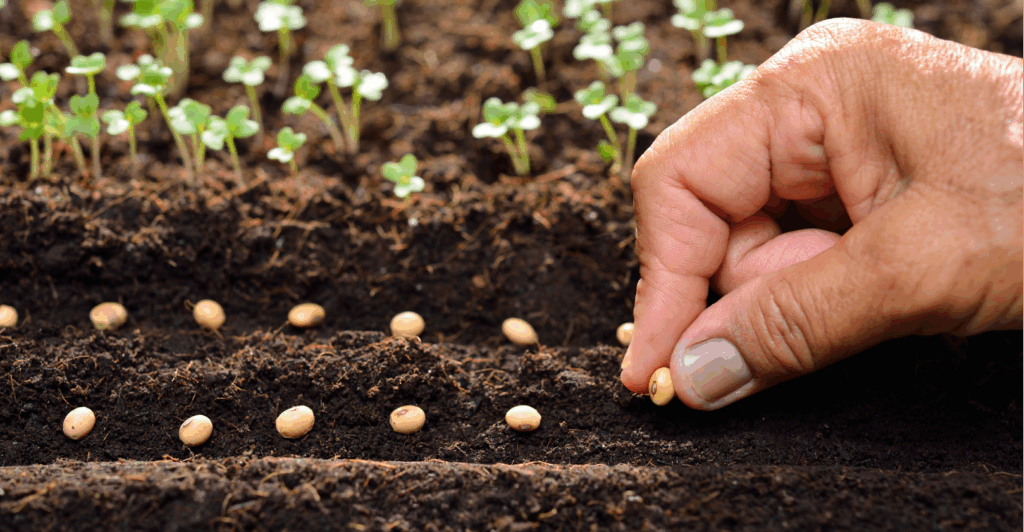
Creating a Historic Loss Assessment, Part 3: Illegal settlements and loss of agricultural revenue

By calculating land dispossession, this report seeks to not only identify what has been taken from Native peoples but also how this theft became the original source of capital that built Colorado and the West.
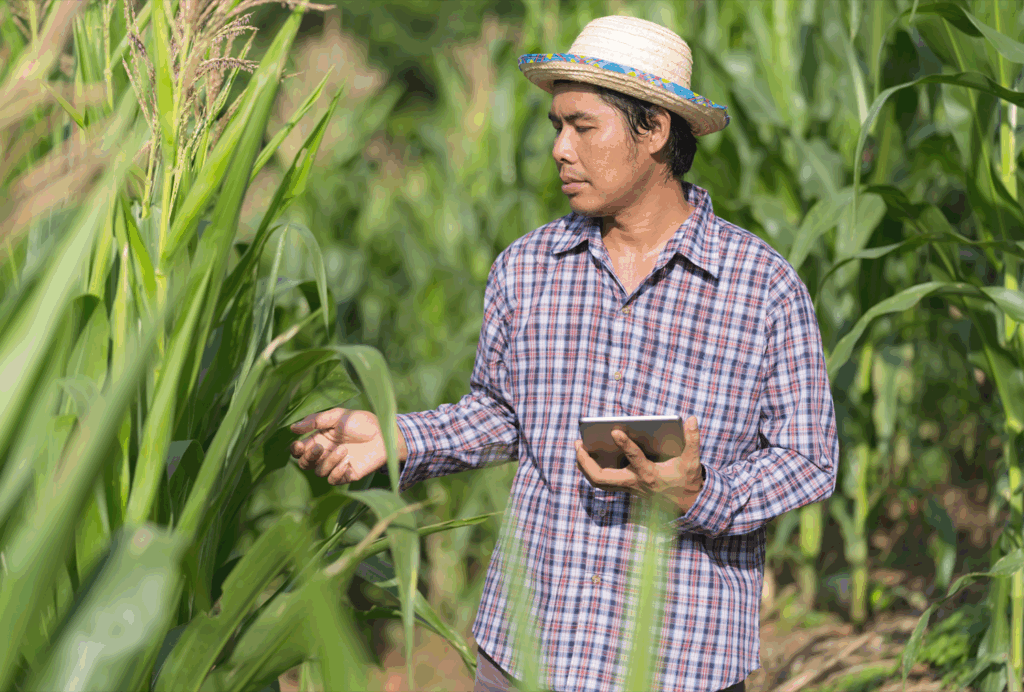
New to the NLIS? Start here!
The Native Lands Advocacy Project (NLAP) compiles, consolidates, and visualizes data resources to support sovereign, sustainable, Native-led land planning and protection.
Keystone Data Tools for Native Land Planning: View the webinar recordings & share your feedback
This month, the Native Lands Advocacy Project (NLAP) wrapped up our webinar series: Keystone Data Tools for Native Land Planning. These webinars introduced attendees to three foundational datasets that Native Nations & citizens can use to make informed, sovereign decisions for their futures: The USDA Census of Agriculture for American Indian Reservations The National Land […]
Creating a Historic Loss Assessment, Part 2: Loss of life and Extraction of minerals
By calculating land dispossession, this report seeks to not only identify what has been taken from Native peoples but also how this theft became the original source of capital that built Colorado and the West.
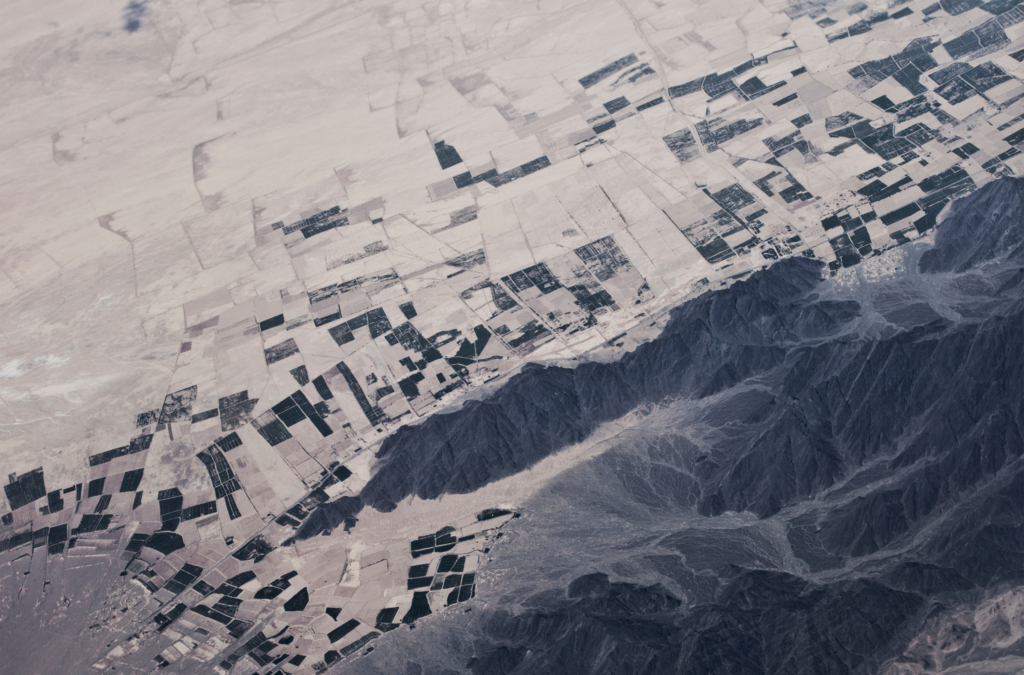
Empowering Tribal Climate Adaptation Through Data

Learn more about the first-of-its-kind Climate Data Portal for US Native Lands—designed to strategically support tribal climate planning.
Introducing the Climate Data Portal for U.S. Native Lands

The Native Lands Advocacy Project (NLAP) is thrilled to announce the launch of our Climate Data Portal for U.S. Native Lands! Developed with funding from the Native American Agriculture Fund, this portal is the result of our dedicated GIS team’s efforts to create & consolidate relevant climate-related data tools into one living resource. NLAP acknowledges […]