Federally-funded Projects in Indian Country

About this Dashboard This data dashboard summarizes data about federally-funded projects within tribal boundaries from the Bipartisan Infrastructure Law and the Infrastructure Reduction Act. The visualization displays funds amounts and categories of federal project for all tribes for years 2022 through 2025 (it has not been modified for eventual funding freezes resulting from the current […]
Bureau of Indian Affairs Budget by Categories
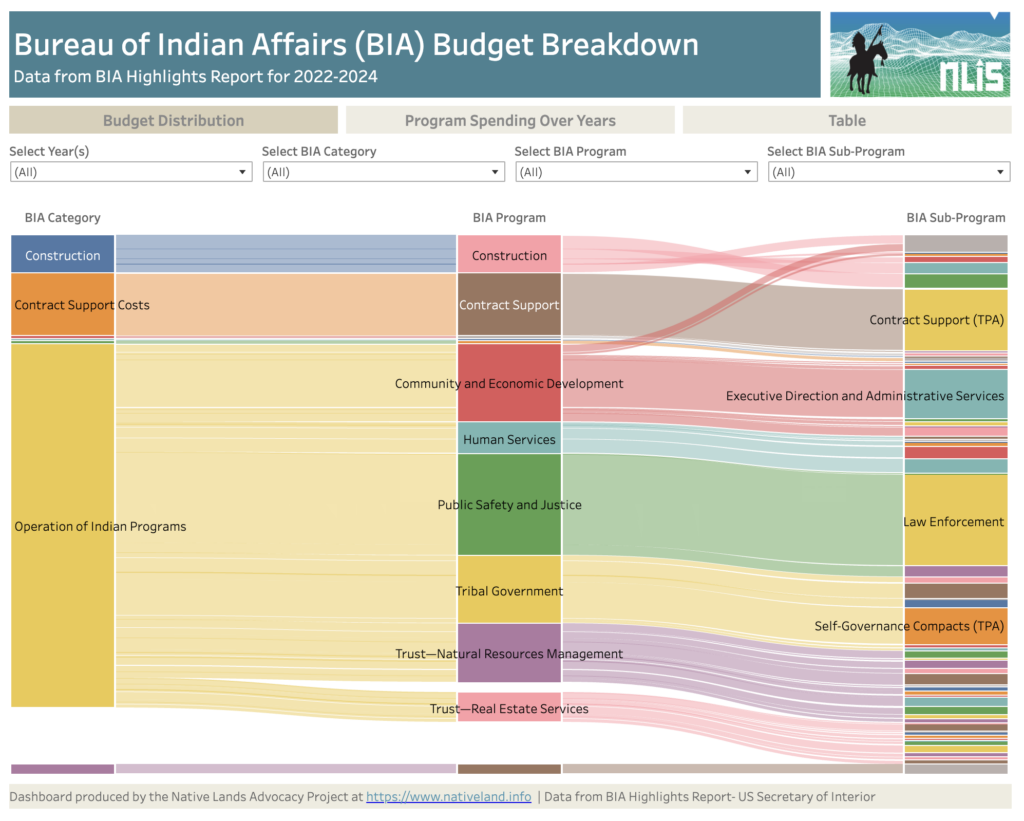
About this Dashboard This data dashboard summarizes data from the United States Secretary of Interior; it features the Bureau of Indian Affairs Yearly Highlights Reports, which show BIA spending by categories, programs and subprograms for years 2022, 2023, annualized CR (estimates) for 2024 and requested budget for 2025. We digitized these static reports in an […]
FSA Spending Dashboard: Insights from 2021 & 2023 Across Native and Non-Native Lands

About this Dashboard This interactive dashboard provides a detailed analysis of USDA Farm Service Agency (FSA) program disbursements for 2021 and 2023, offering insights into federal spending on agricultural programs across the United States. The dashboard includes data for all FSA program recipients, providing a comprehensive view of how funds were allocated during these years […]