Available Water in Soil on US Native Lands
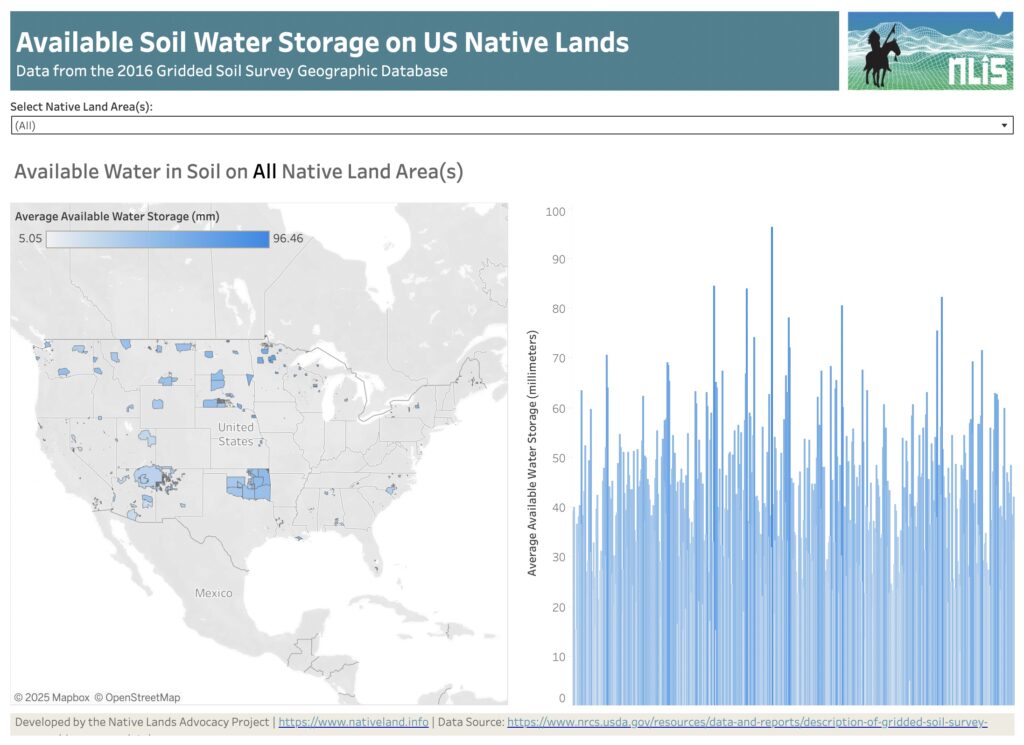
About this Dashboard This dashboard features a reservation-level view of the available water data in soil on all tribal lands in the US. Data comes from the USGS Gridded soil survey for 2016. The “available water in soil” variable from gridded soil surveys refers to the quantity of water that a soil can store and […]
Credit Insecurity on US Native Lands
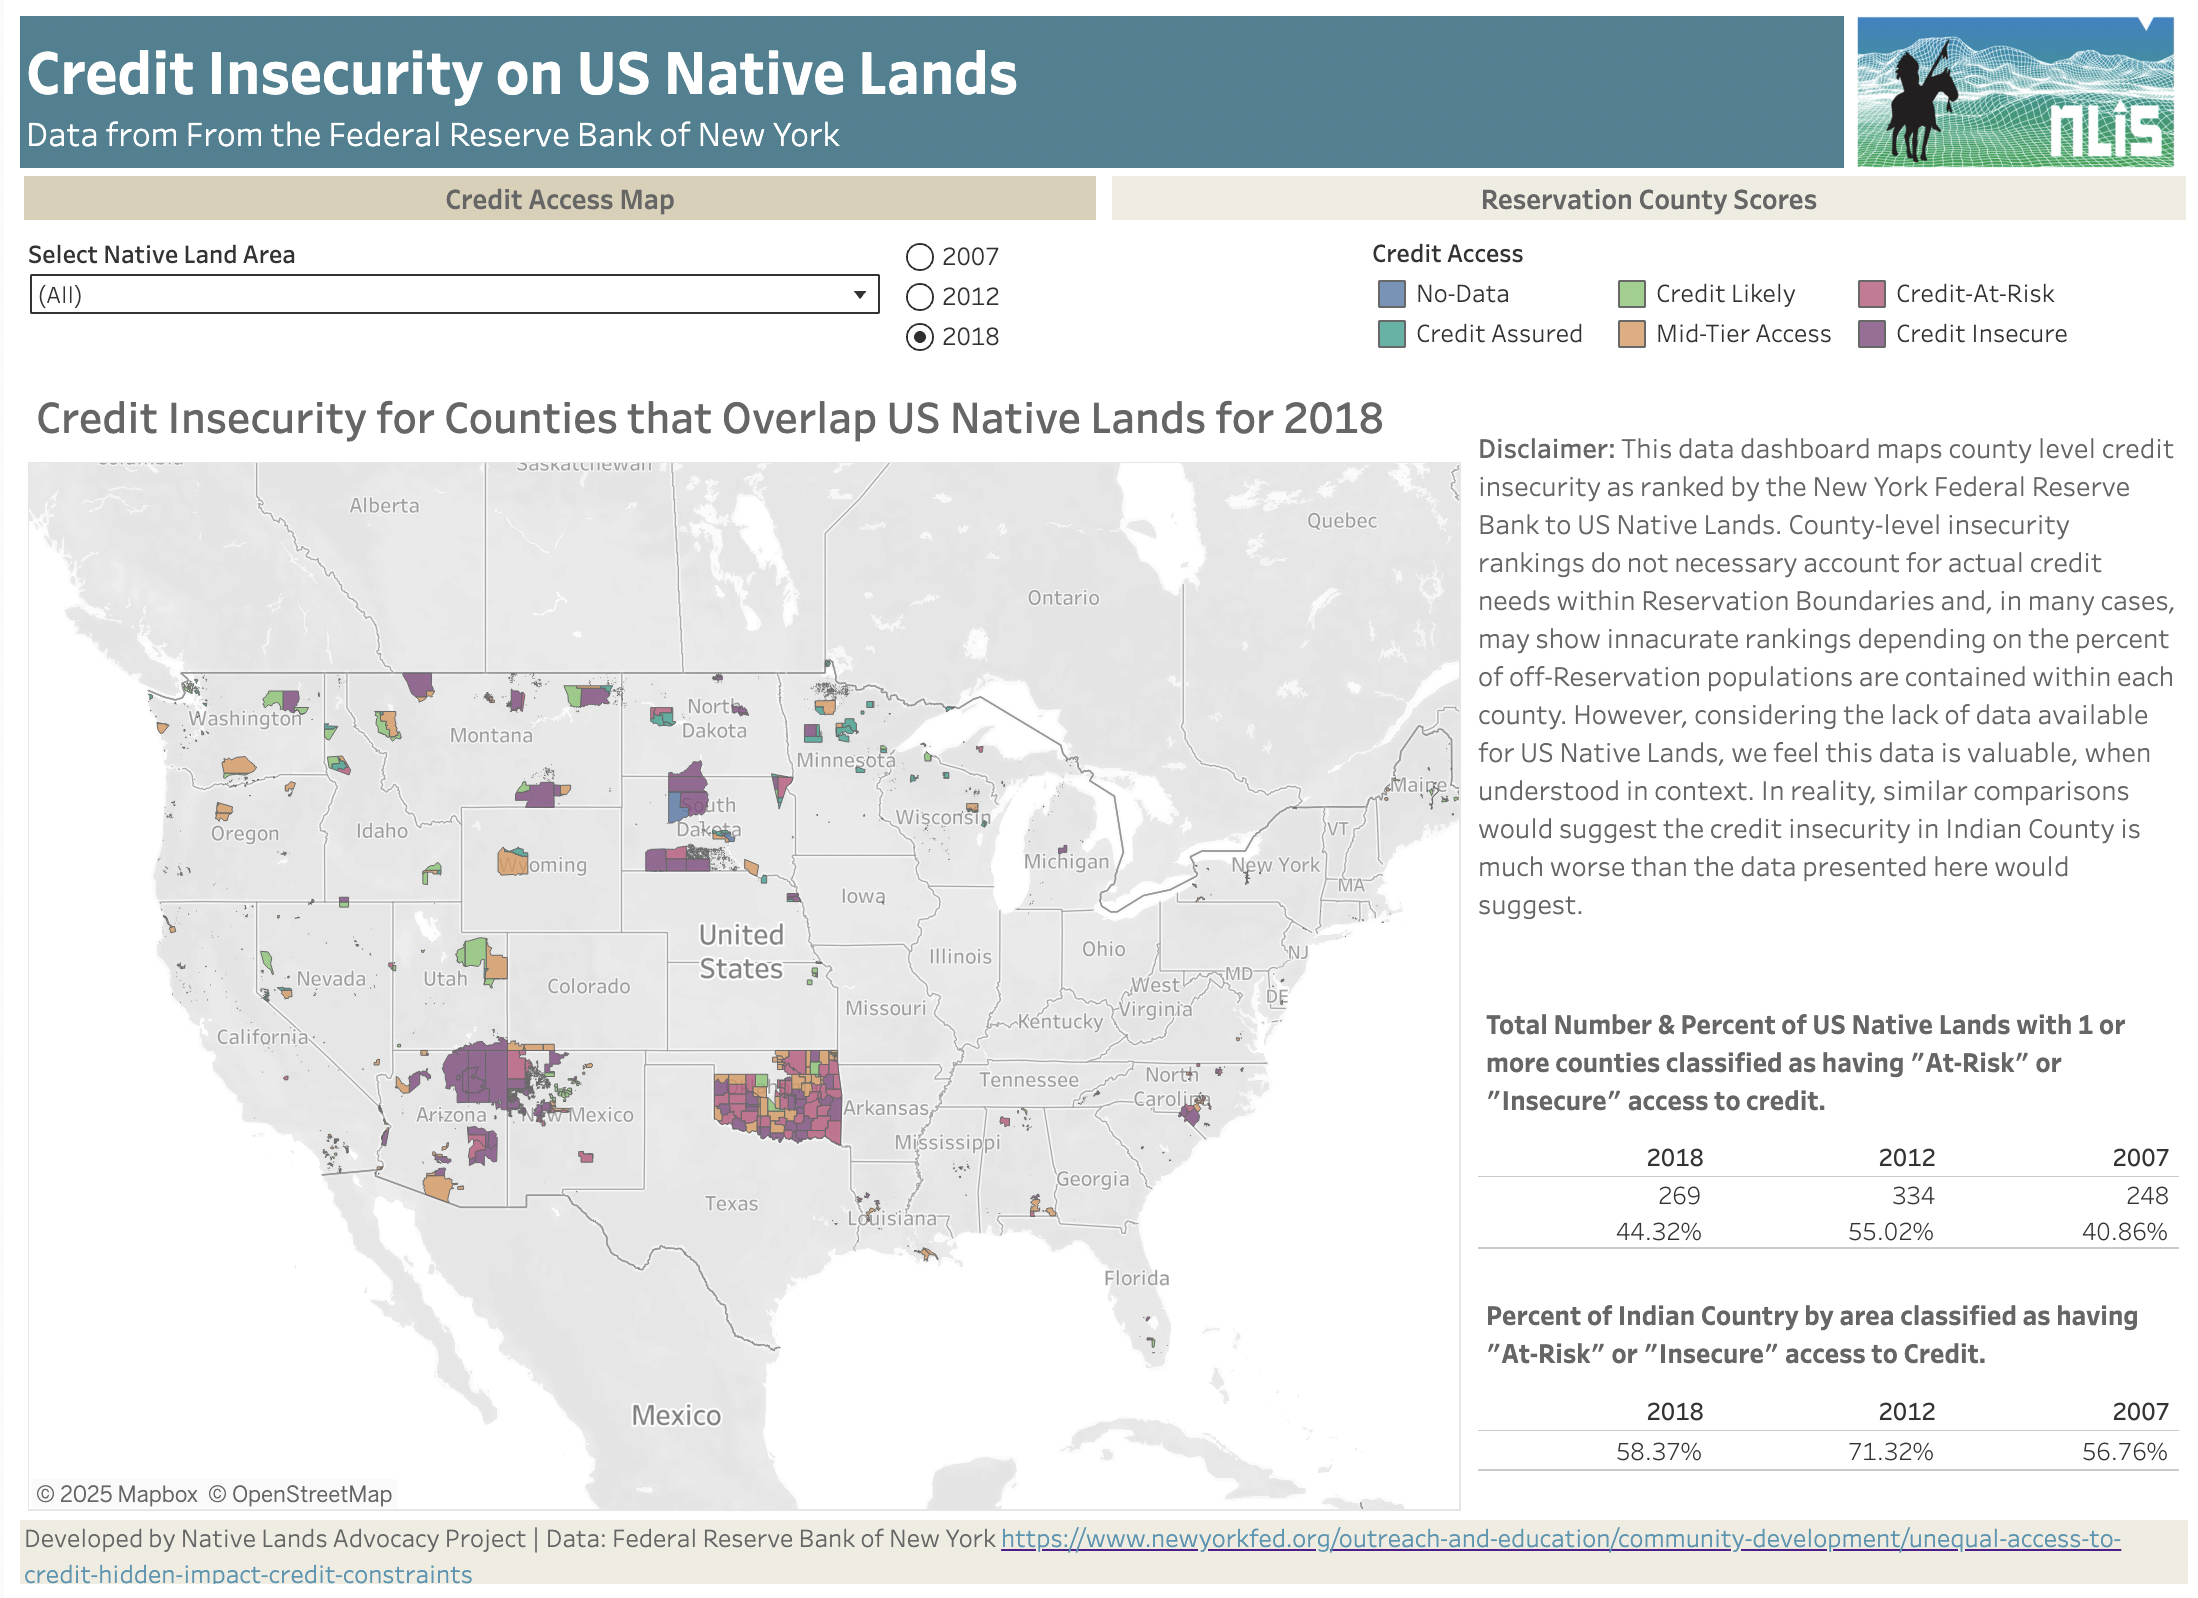
About this Dashboard This data dashboard maps county-level credit insecurity as ranked by the New York Federal Reserve Bank to US Native Lands. County-level insecurity rankings do not necessarily account for actual credit needs within reservation boundaries and, in many cases, may show inaccurate rankings depending on the percentage of off-reservation population contained within each […]
We Remain Committed to Empowering Tribal Self-Determination & Data Sovereignty

The Native Lands Advocacy Project (NLAP) was founded in 2019 to provide much-needed data support to Native American communities. As a project of the nonprofit Village Earth, NLAP is inspired and guided by 30+ years of grassroots work in direct support of communities’ needs. Since NLAP’s inception, our work has been guided by the needs […]
These Water-Focused Data Tools Support Tribal Land & Climate Planning
The Native Land Information System (NLIS) is home to over 120 public, free data tools and resources that were created to support tribal communities in developing climate-smart land management strategies. We are excited to share some of our new water data tools with you, as well as reintroduce you to some of our earlier water-related […]
Keystone Data Tools for Native Land Planning: View the webinar recordings & share your feedback
This month, the Native Lands Advocacy Project (NLAP) wrapped up our webinar series: Keystone Data Tools for Native Land Planning. These webinars introduced attendees to three foundational datasets that Native Nations & citizens can use to make informed, sovereign decisions for their futures: The USDA Census of Agriculture for American Indian Reservations The National Land […]
Introducing the 2022 Updates to the USDA’s Census of Agriculture Dashboard
The Native Lands Advocacy Project (NLAP) is pleased to announce that our Agriculture on Native Lands Dashboard is now updated with data from the 2022 Census of Agriculture for American Indian Reservations! These updates, which we examine in this blog post, add to the dashboard’s functionality for users seeking to examine land and agricultural data […]
Introducing the Climate Data Portal for U.S. Native Lands

The Native Lands Advocacy Project (NLAP) is thrilled to announce the launch of our Climate Data Portal for U.S. Native Lands! Developed with funding from the Native American Agriculture Fund, this portal is the result of our dedicated GIS team’s efforts to create & consolidate relevant climate-related data tools into one living resource. NLAP acknowledges […]
SSURGO Soil Classification Viewer for US Native Lands
This map shows the canopy cover percentages and land cover types on Reservations and USFS lands.
Soil Salinity in U.S. Native Lands
This map displays soil salinity data layers derived from the Harmonized World Soil Database (HWSD) Global Soil Quality – Constraints due to Excess Salts (HWSD Excess Salts). This Soil Salinity data on US Native Lands is presented here as a potential resource for Tribes to use in natural resource and climate adaptation assessment and planning.
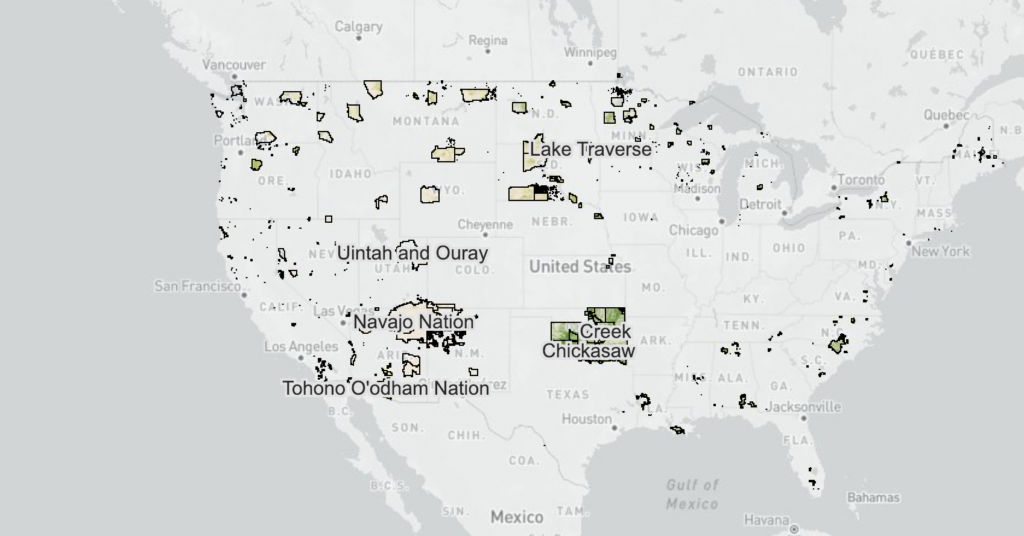
Crop Diversity on US Native Lands
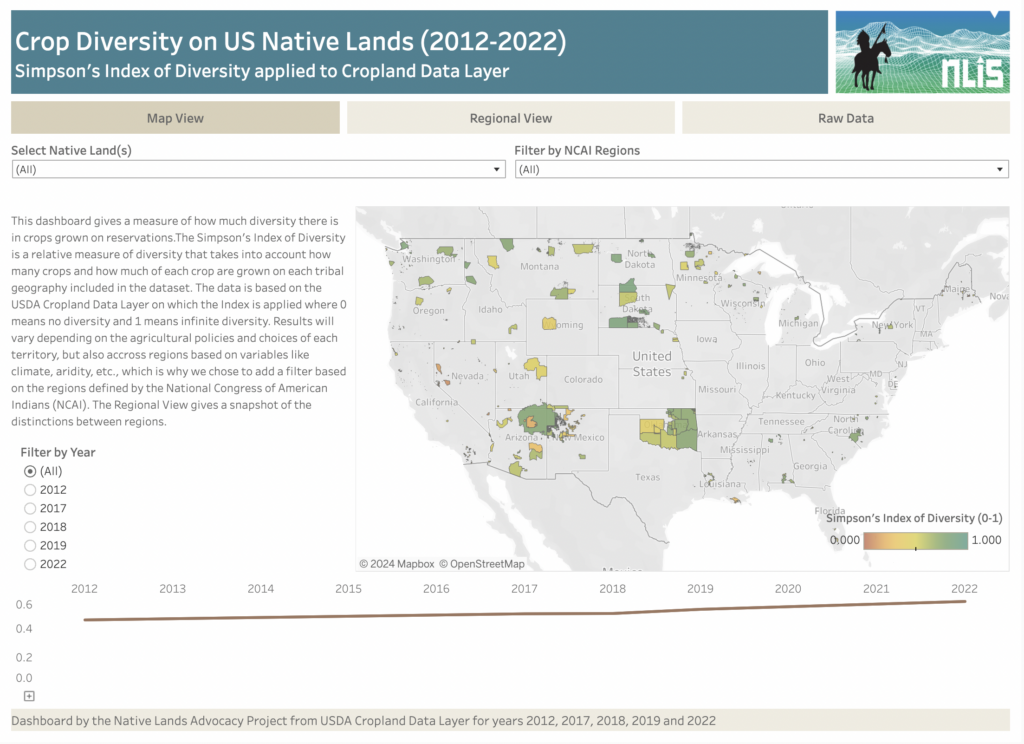
About this Dashboard The Crop Diversity Dashboard is an estimate of the relative diversity of crops grown on tribal lands. We use the Simpson’s Index of Diversity to estimate crop diversity from both the variety of crops grown and their respective acres within each reservation, with 0 meaning no crop diversity and 1 meaning infinite […]
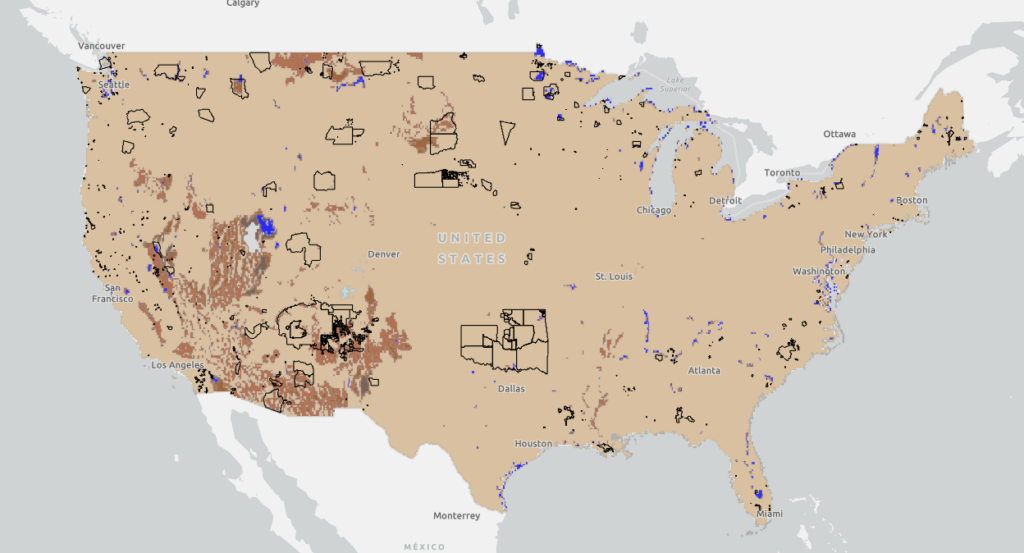
Agricultural Water Stress on US Native Lands
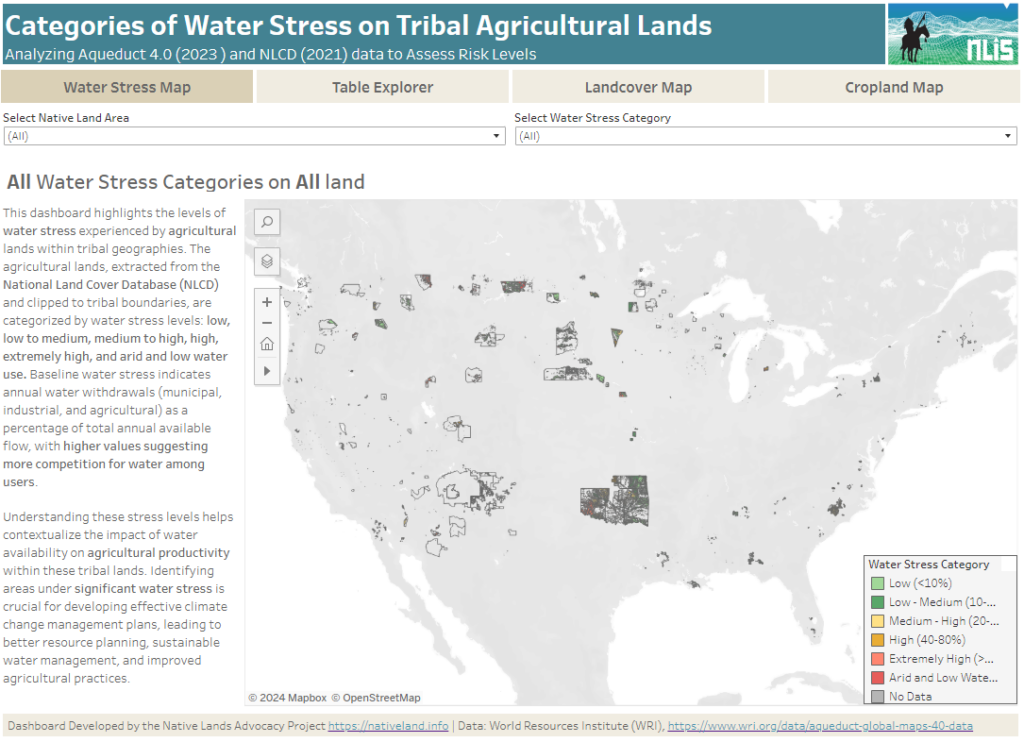
About this Dashboard This data dashboard summarizes data from the World Resources Institute, and the National Land Cover Database for Native Lands in the United States. It highlights the distribution and impact of water stress on agricultural lands within Native boundaries. The dashboard features detailed maps and interactive elements, allowing users to explore different water […]
Announcing Our New Storymap: Building Up Native Youth in Agriculture
How well-represented are Native youth in the overall population of Native agriculture producers? What difficulties do Native youth face when entering agriculture, and what resources exist to support and empower them? The Native Lands Advocacy Project (NLAP) is happy to announce our new storymap exploring these questions: Building Up Native Youth in Agriculture! One of […]