
Bureau of Indian Affairs Budget by Categories
About this Dashboard This data dashboard summarizes data from the United States Secretary of Interior; it features the Bureau of Indian Affairs Yearly Highlights Reports,
What climate concerns do tribes across the United States share? How do these climate concerns vary by region? Our Tribal Climate Literature Review identifies preliminary answers to these questions and provides insights to empower tribal climate planning.
The Native Lands Advocacy Project (NLAP) is pleased to announce that our Agriculture on Native Lands Dashboard is now updated with data from the 2022
About this Dashboard This interactive dashboard provides a detailed analysis of USDA Farm Service Agency (FSA) program disbursements for 2021 and 2023, offering insights into
The Native Lands Advocacy Project (NLAP) is thrilled to announce the launch of our Climate Data Portal for U.S. Native Lands! Developed with funding from
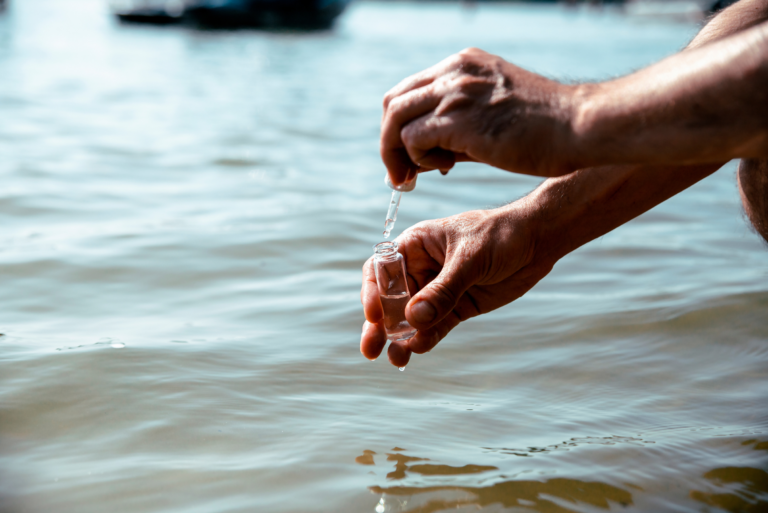
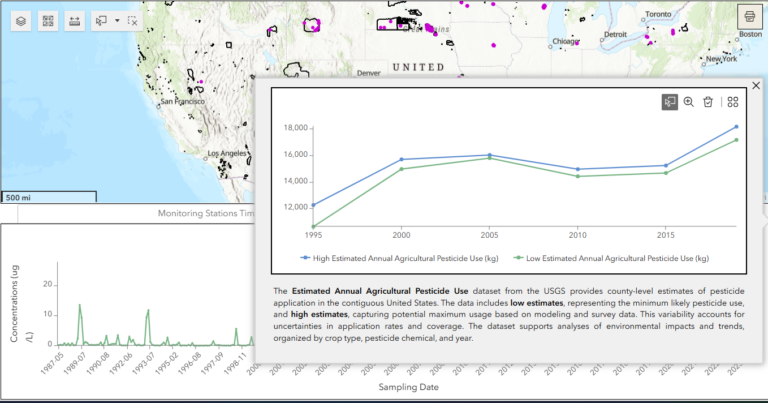
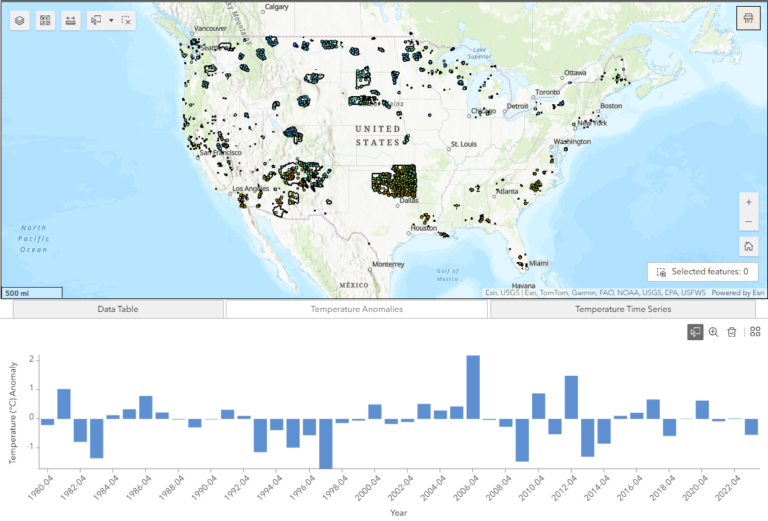
Explore pesticide concentrations in groundwater and surface waters, as well as estimated agricultural pesticide use, across US Native Lands with this interactive dashboard. Users can select specific Native Lands, filter data by pesticide, year range, and water type, and visualize trends in pesticide concentrations and use. The dashboard includes both monitoring-level data from water-quality stations and county-level pesticide use estimates, providing a comprehensive view of pesticide impacts on these vital ecosystems.
As Native nations reintroduce buffalo to the lands they’ve stewarded since time immemorial, their lands, ecosystems, and communities heal.
Explore the local temperature measurements across groundwater and surface waters of US Native Lands with this interactive dashboard. Users can select specific Native Lands, filter data by month and year range, and visualize trends to better understand local temperature changes in these vital ecosystems.
Native farmers and ranchers are major contributors to their reservation economies, food systems, and land stewardship. Recognizing this, NLAP has created dedicated pages of Data Tools for Native Farmers and Data Tools for Native Ranchers. Read more about these pages here.
This storymap walks through each resource introduced on our “Data for Native Farmers” topic page.
About this Dashboard This interactive dashboard provides a comprehensive analysis of average wind speed patterns across tribal lands in North America, using data from the