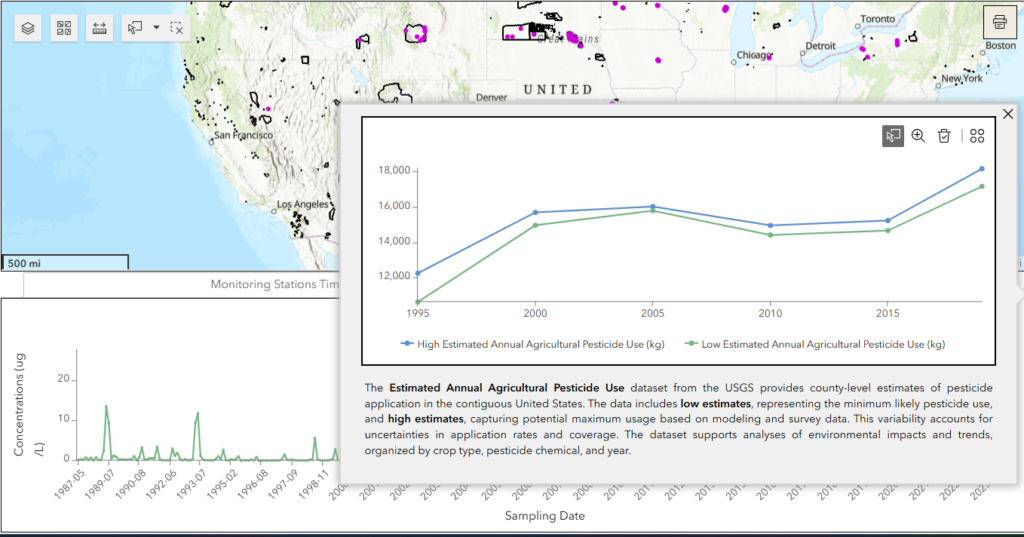
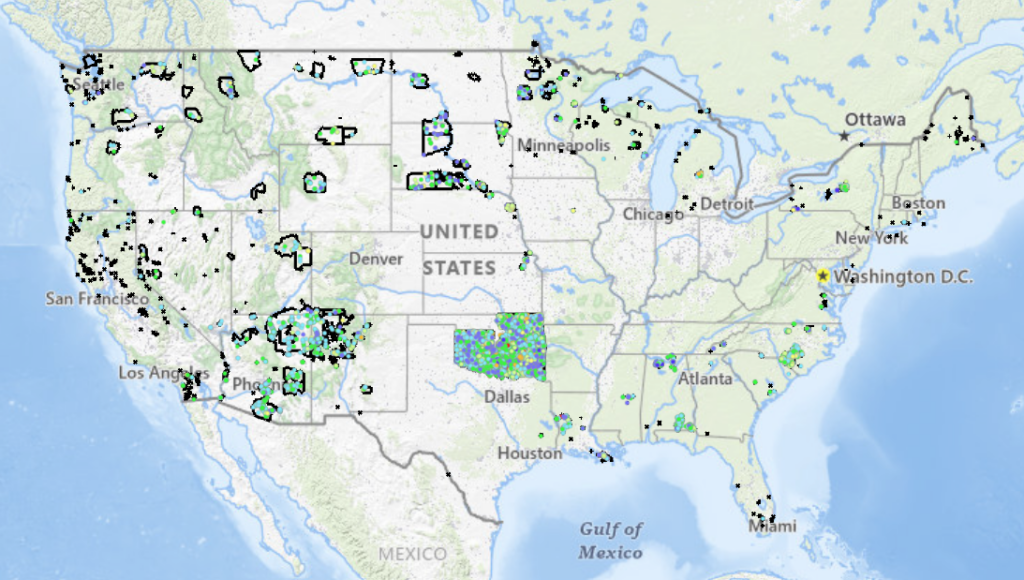
Water Quality Viewer – Pesticides
Explore pesticide concentrations in groundwater and surface waters, as well as estimated agricultural pesticide use, across US Native Lands with this interactive dashboard. Users can select specific Native Lands, filter data by pesticide, year range, and water type, and visualize trends in pesticide concentrations and use. The dashboard includes both monitoring-level data from water-quality stations and county-level pesticide use estimates, providing a comprehensive view of pesticide impacts on these vital ecosystems.
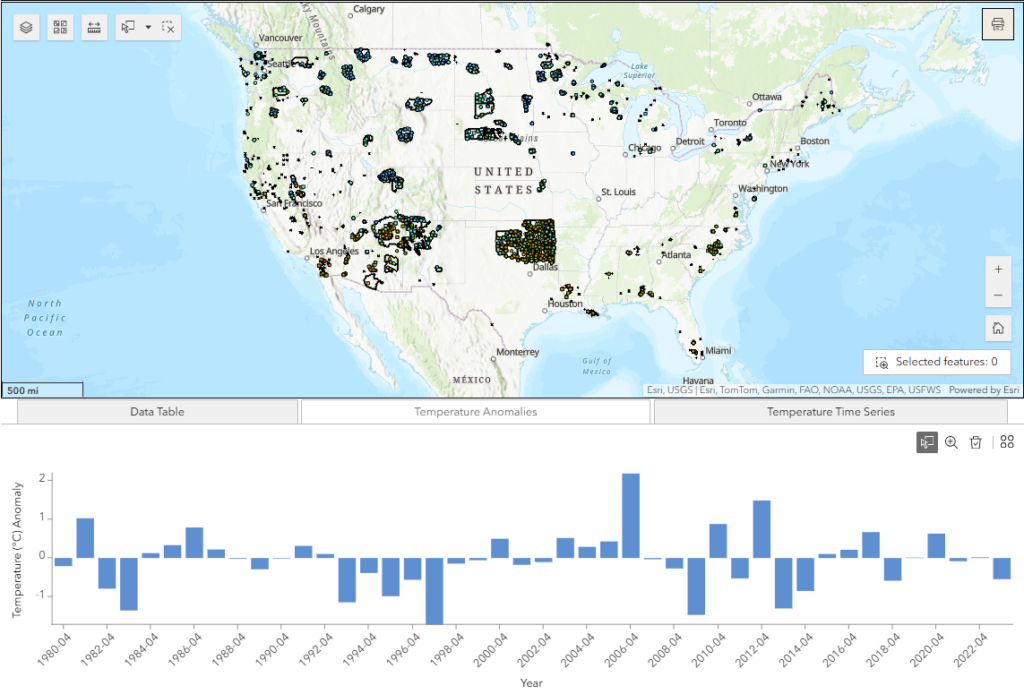
Water Quality Viewer – Temperature
Explore the local temperature measurements across groundwater and surface waters of US Native Lands with this interactive dashboard. Users can select specific Native Lands, filter data by month and year range, and visualize trends to better understand local temperature changes in these vital ecosystems.
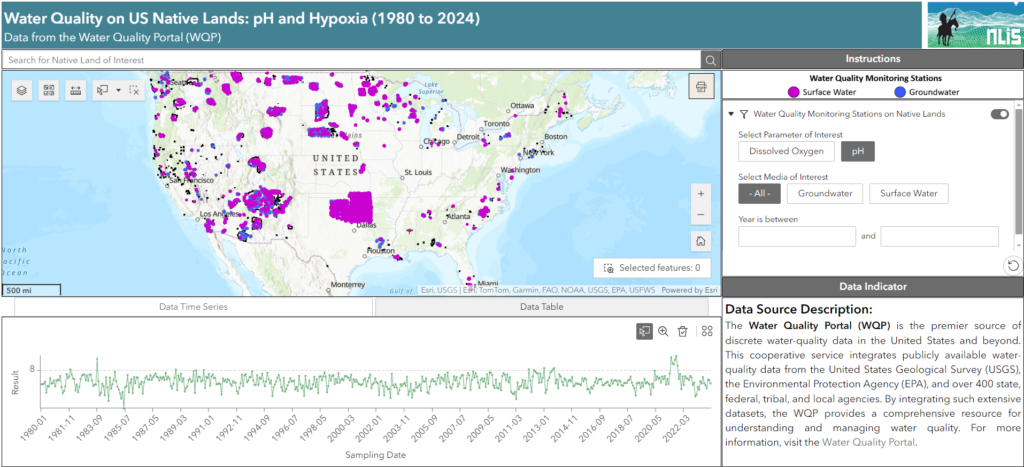
Water Quality Viewer – pH and Hypoxia
Explore the pH and dissolved oxygen levels across groundwater and surface waters of US Native Lands with this interactive dashboard. Users can select specific Native Lands, filter data by parameter and year range, and visualize trends to better understand hypoxia and water quality in these vital ecosystems.
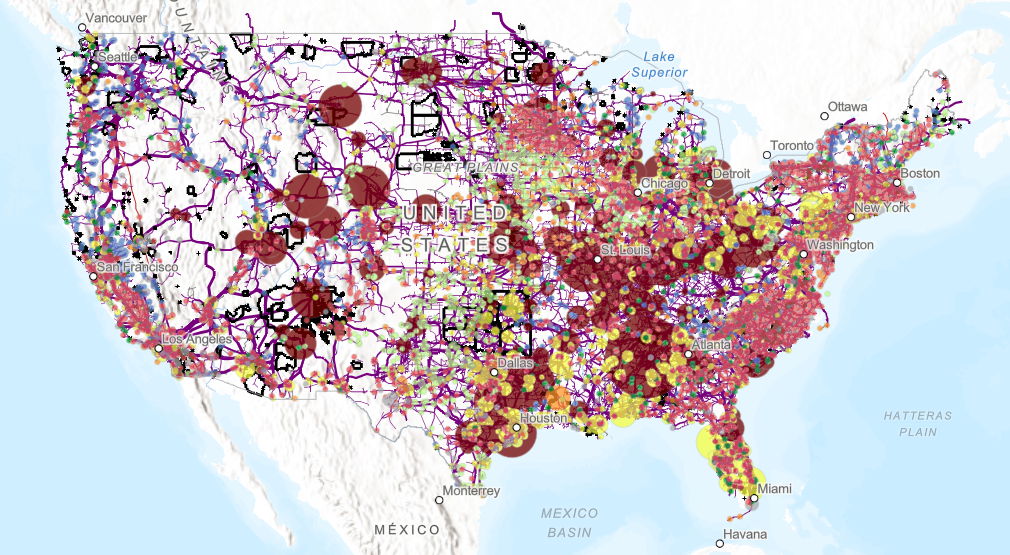
Energy Access Viewer
Explore detailed data on power plant emissions, energy generation, and infrastructure with our interactive dashboard. Specifically designed for US Native Lands, it provides insights into environmental impacts and energy dynamics in these regions.
Culvert Condition Viewer
Explore Tribal Lands in the lower 48 states with this interactive map, showcasing culvert conditions and National Bridge Inventory (NBI) ratings to support environmental analysis and decision-making.
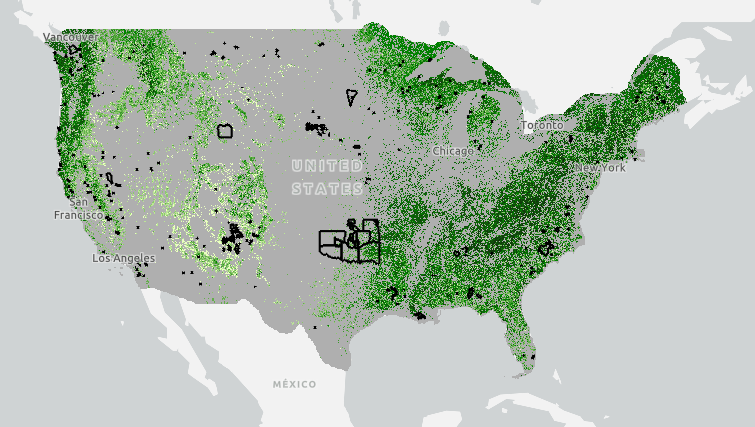
Tree Canopy Coverage Viewer
This viewer shows the canopy cover percentages in 2021 and changes in proportion of land surface covered by trees in the native lands across the United States.
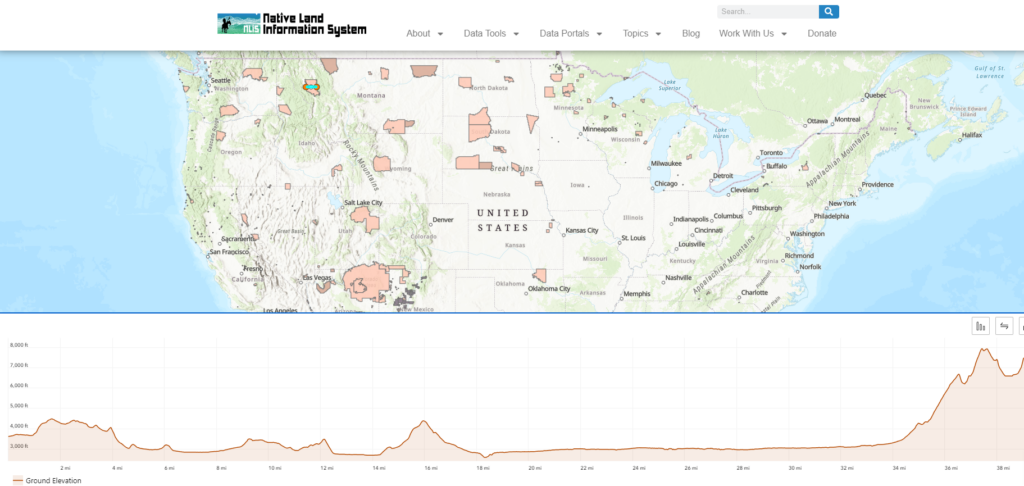
Elevation Profile Explorer
Welcome to the Elevation Profile Explorer, a powerful tool designed to help you understand the terrain and elevation changes across Native lands in the United States.
SSURGO Soil Classification Viewer for US Native Lands
This map shows the canopy cover percentages and land cover types on Reservations and USFS lands.
Soil Salinity in U.S. Native Lands
This map displays soil salinity data layers derived from the Harmonized World Soil Database (HWSD) Global Soil Quality – Constraints due to Excess Salts (HWSD Excess Salts). This Soil Salinity data on US Native Lands is presented here as a potential resource for Tribes to use in natural resource and climate adaptation assessment and planning.
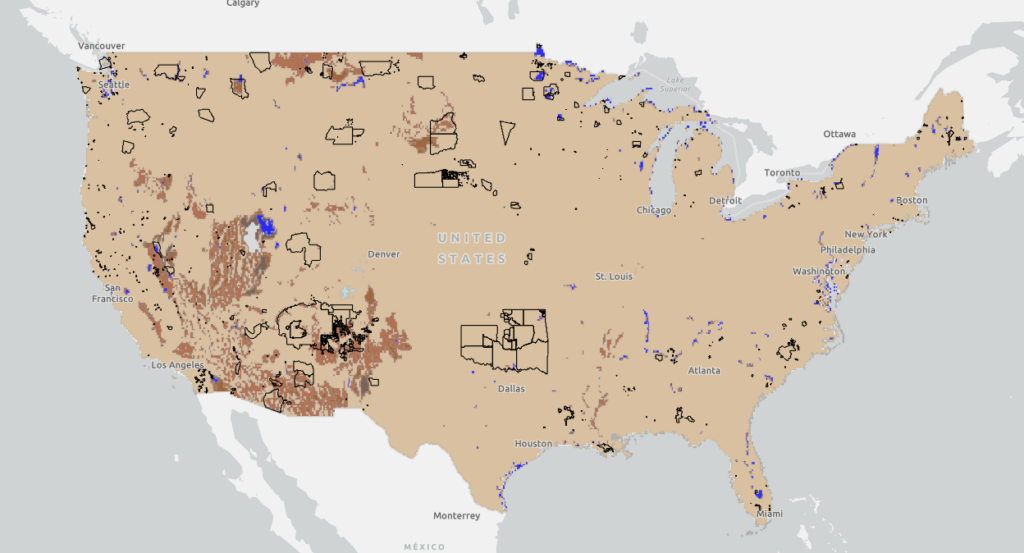
Change in Rain & Snow Patterns on U.S. Native Lands
This map displays data layers based on the EPA’s Climate Change Indicators in the United States report, specifically focusing on Change in Rain & Snow Patterns on U.S. Native lands. On this map, view layers related to change in snowfall, precipitation, snow-to-precipitation ratio, and April snowpack in western US.
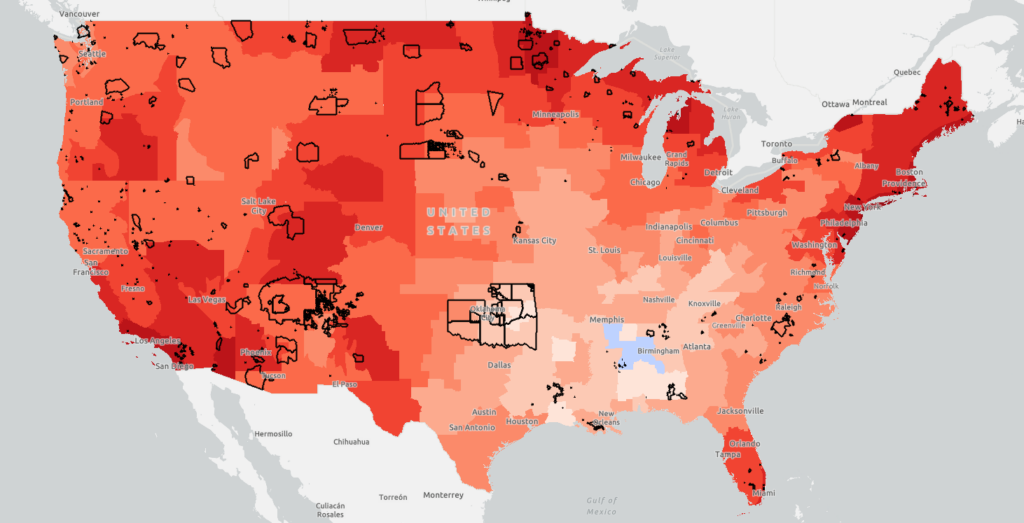
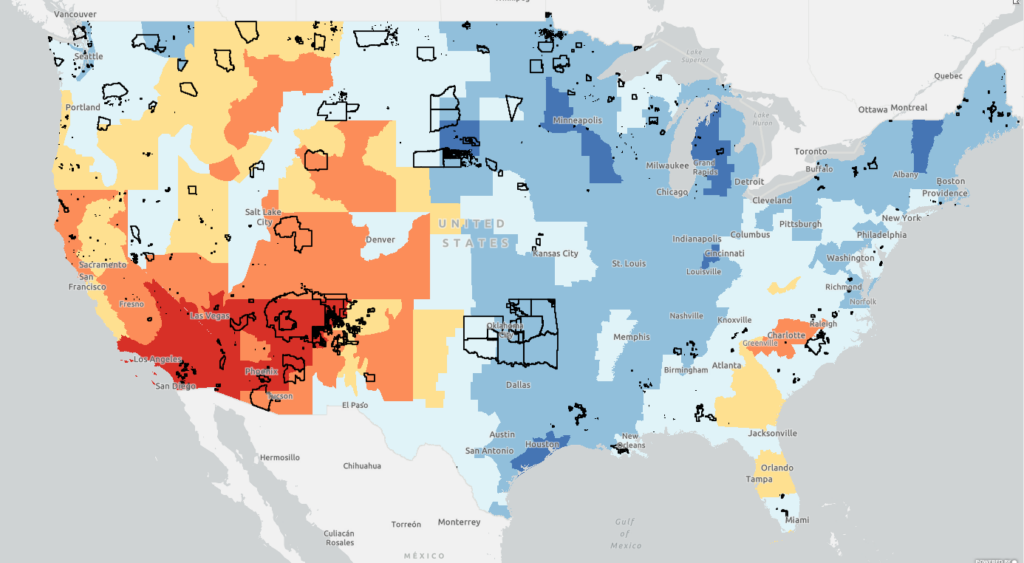
Temperature Change Patterns on U.S. Native Lands
This map displays data layers based on the EPA’s Climate Change Indicators in the United States report, specifically focusing on Temperature Change Patterns on U.S. Native lands. On this map, view layers related to annual average air temperatures, unusually hot temperatures, and unusually low temperatures.
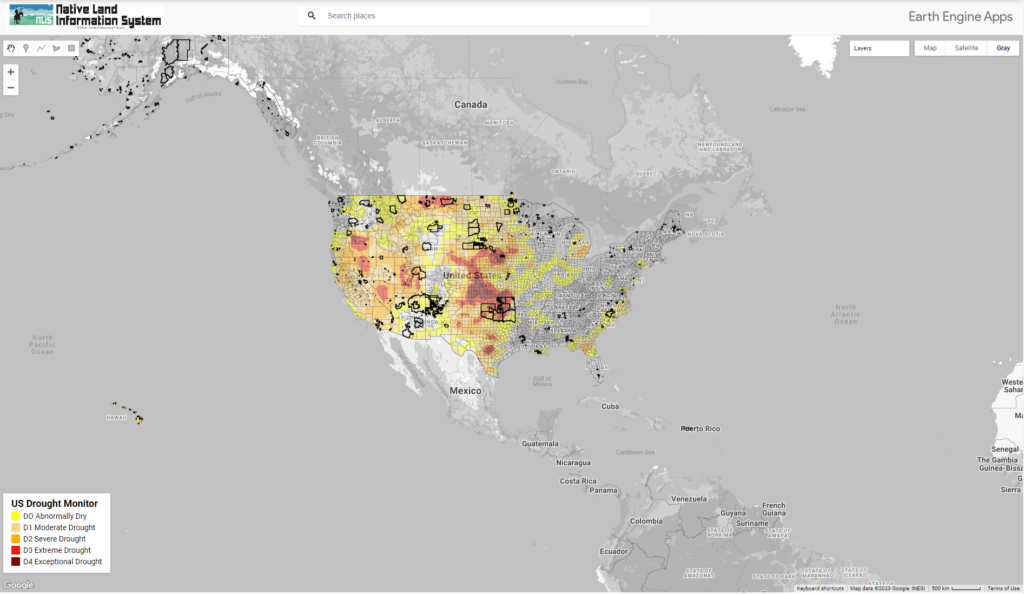
US Drought Monitor (Google Earth Engine)
This map displays US Drought Conditions updated every Thursday as reported by National Drought Mitigation Center (NDMC)
Forest Lands Viewer
This map shows the canopy cover percentages and land cover types on Reservations and USFS lands.
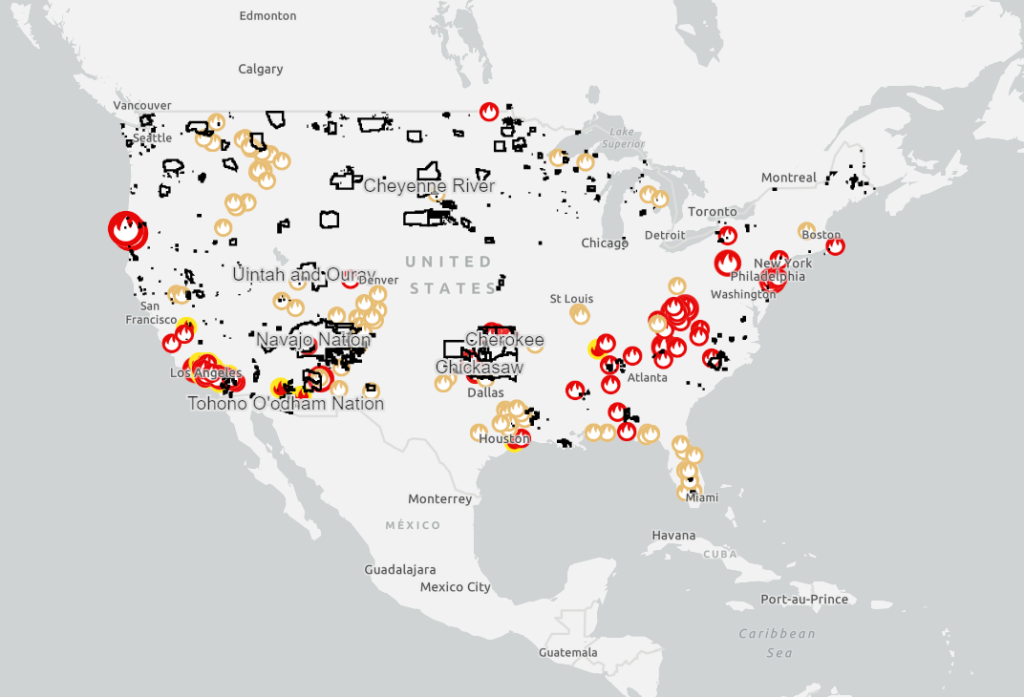
Thermal Activity on US Native Lands
This map shows satellite detected hotspots and wildfire activity provided by federal, state, and local agencies.
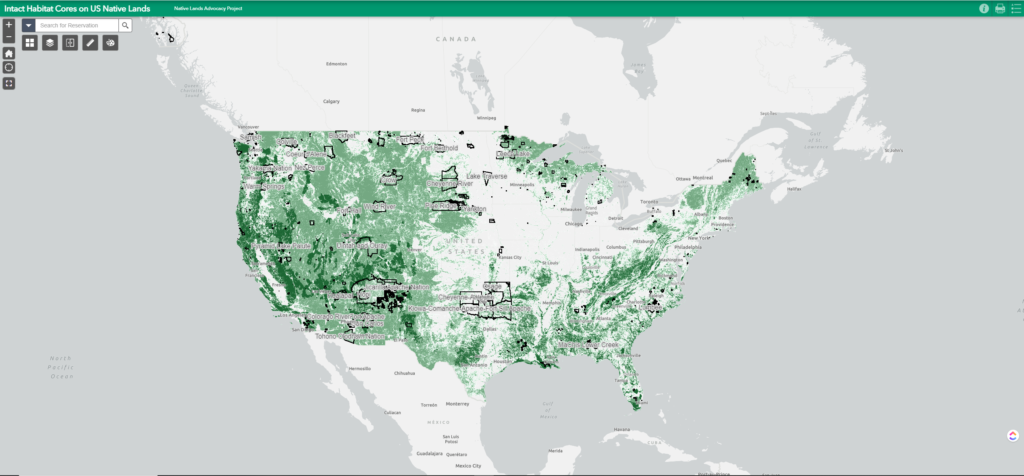
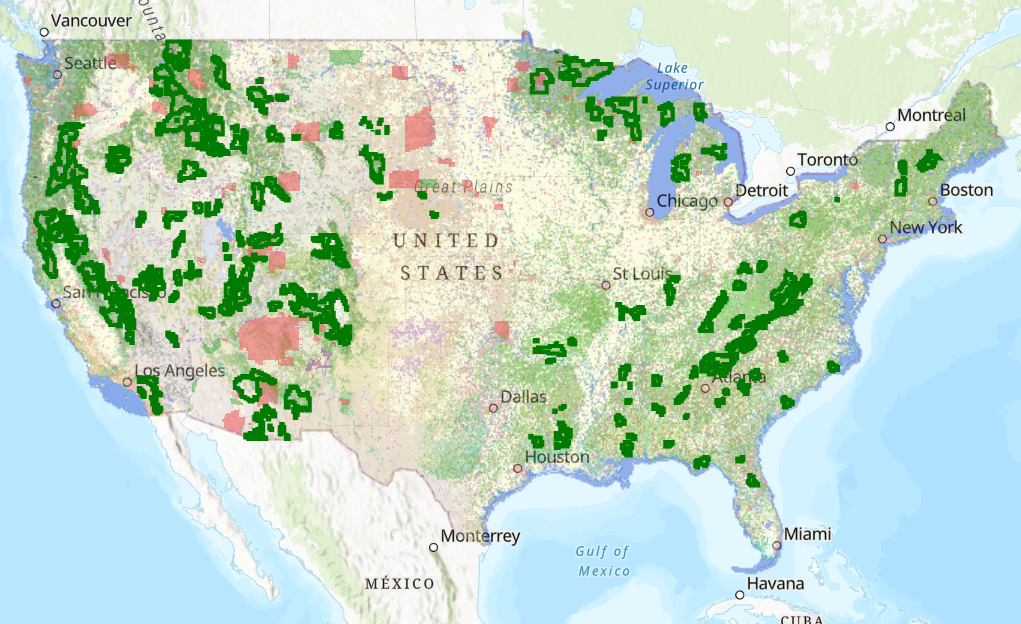
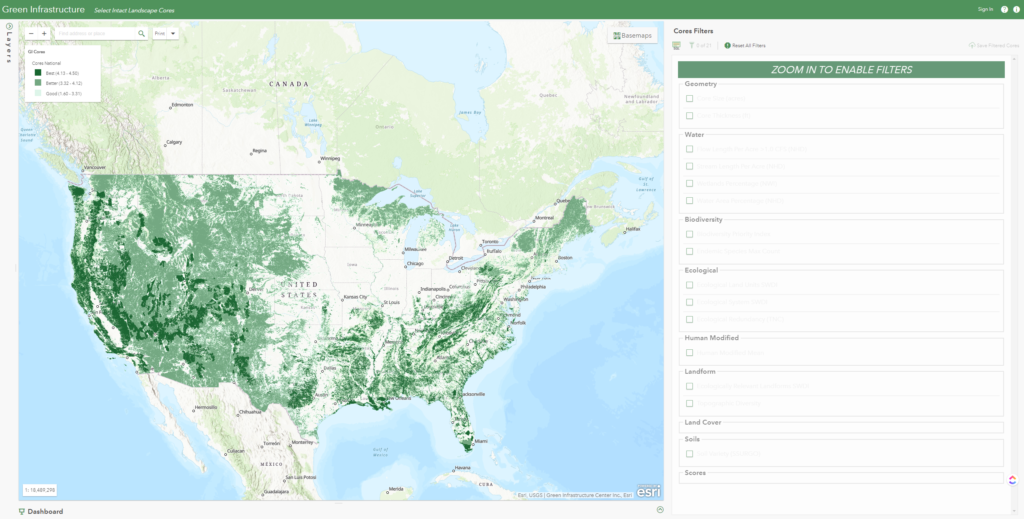
Intact Habitat on US Native Lands
This layer represents modeled Intact Habitat Cores, or minimally disturbed natural areas at least 100 acres in size and greater than 200 meters wide.
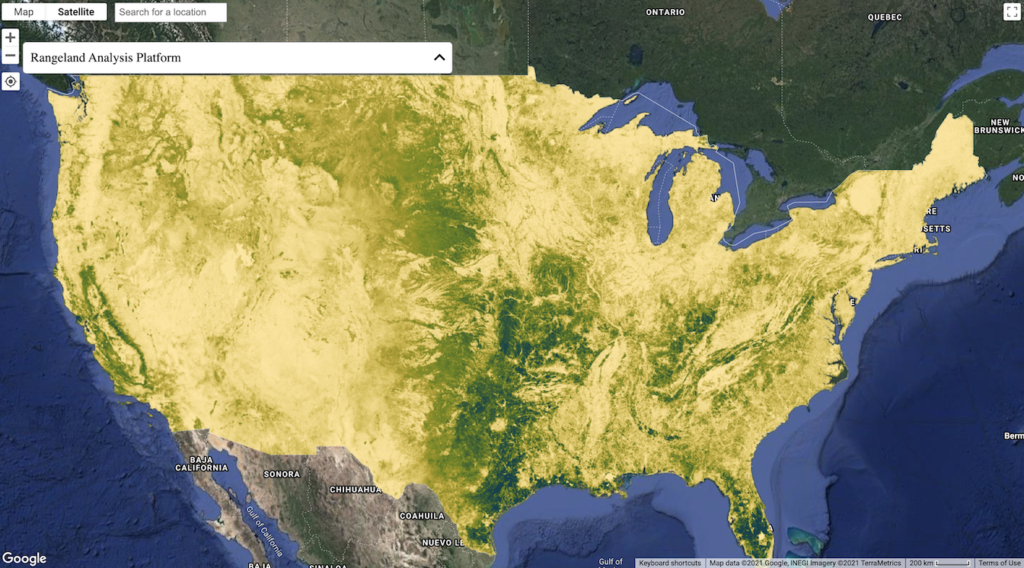
RAP – Rangeland Analysis Platform
Fast, powerful, and free, the Rangeland Analysis Platform is an innovative online tool that quickly visualizes and analyzes vegetation data for the United States. Launch the app to examine trends at pasture, ranch, watershed, or broader scales. Datasets include:
Intact Habitat Selector Tool
Explore and filter a national database of intact landscape cores to identify important habitat your tribe seeks to protect based on species richness, water availability, landscape variability, soils, etc.
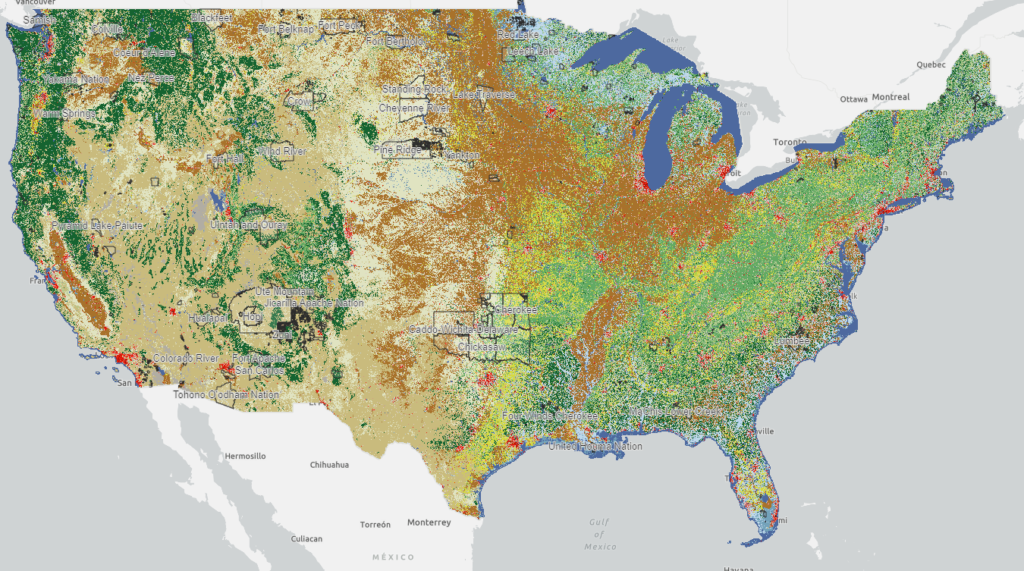
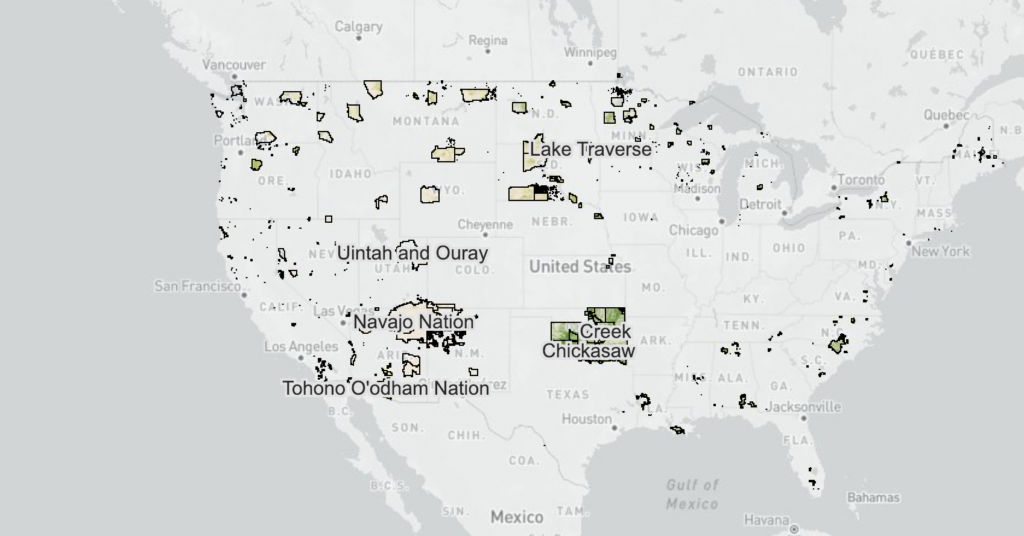
National Land Cover Database: Tribal Lands Viewer
This map viewer visualizes every available year of the National Land Cover Database (NLCD) and makes it possible to filter for 848 native land areas (reservations and off reservation trust lands) in the United States for 2001 and 2019.
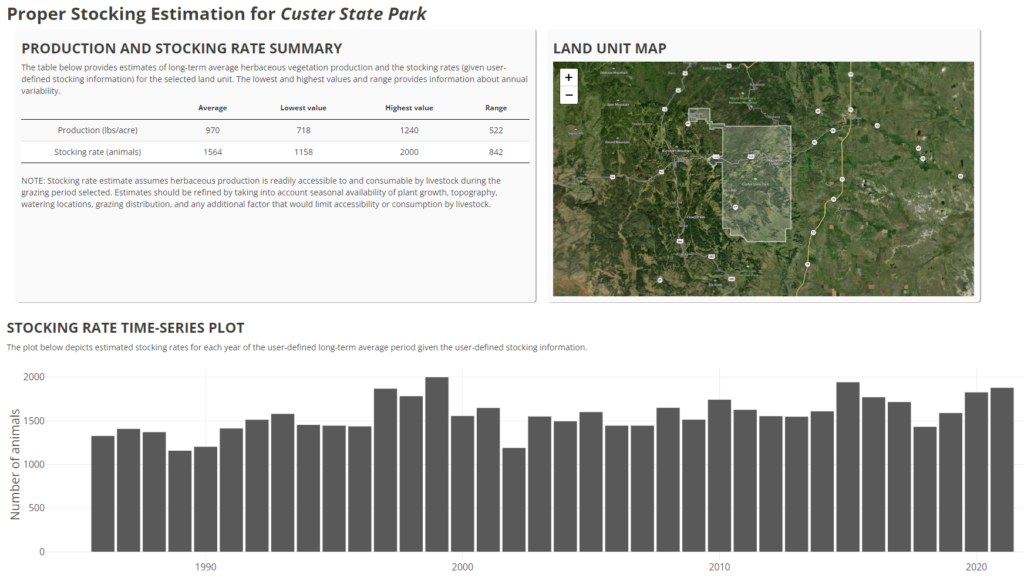
RAP – Rangeland Production Explorer
The RAP Production explorer enables you to compare current forage cover (updated every 16 days) for a specifc area (either drawn or using an uploaded boundary file) against 36 years of production.
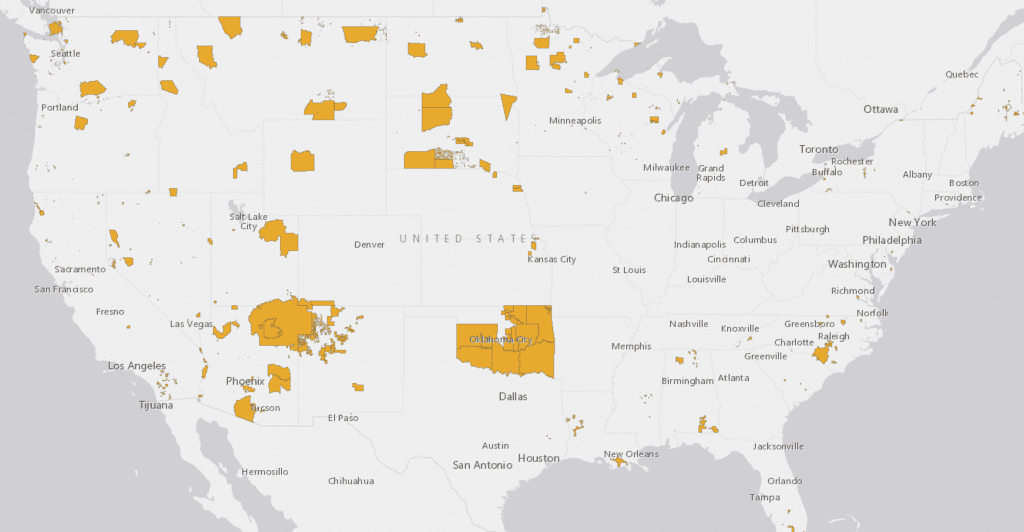
Official US Native Land Area Representations
This maps displays US Native lands as Represented by the US Census Bureau, US Bureau of Indian Affairs, and 1978 India Claims Commission.
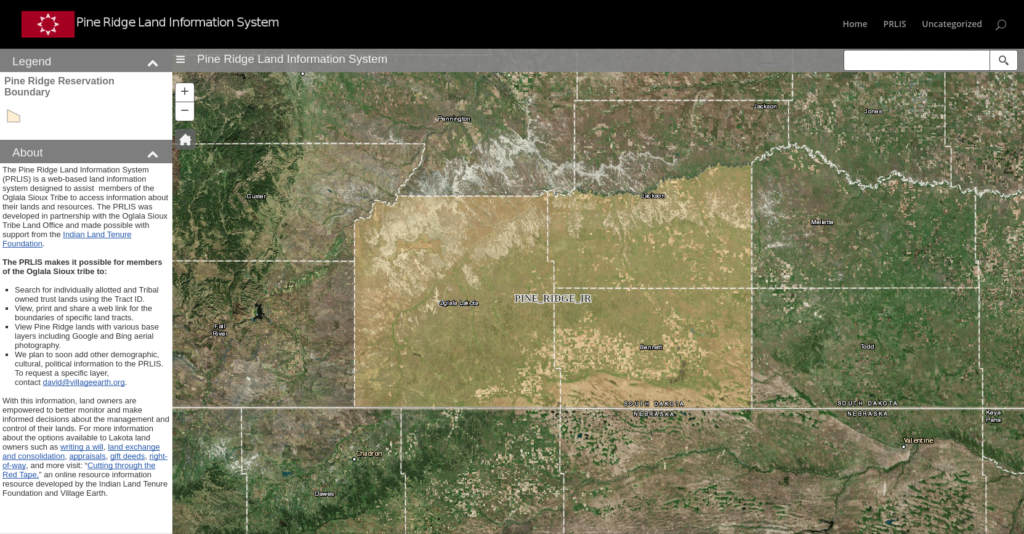
Pine Ridge Land Information System (PRLIS)
The Pine Ridge Land Information System was developed by Village Earth in partnership with the Oglala Sioux Tribe Land office. The PRLIS makes it possible to search for parcels using a Tract ID. The PRLIS also houses original allotment maps, count plat maps, range unit maps, Land Cover Data, and more.
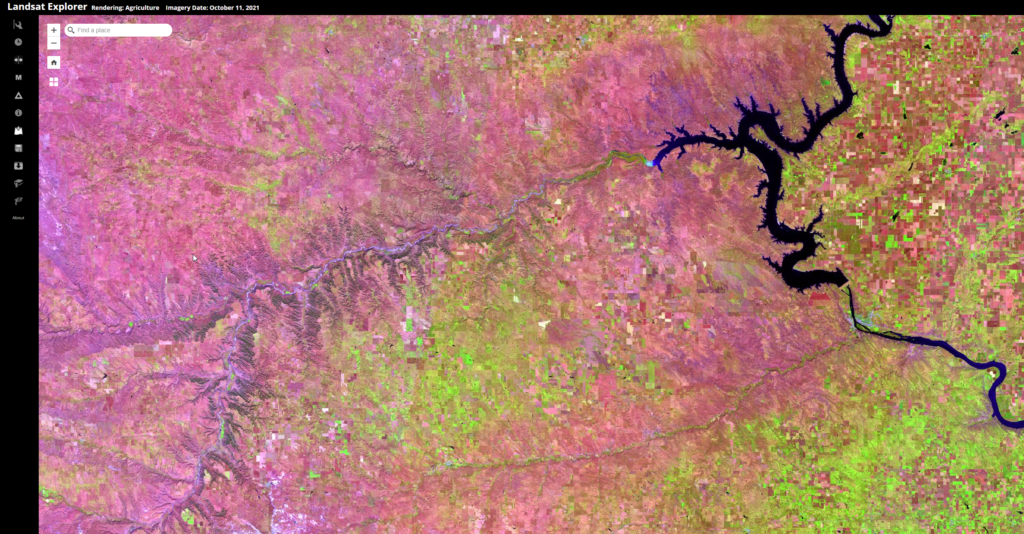
ESRI Landsat Explorer
Esri Landsat Explorer app provides the power of Landsat satellites, which gather data beyond what the eye can see. Use this app to draw on Landsat’s different bands to better explore the planet’s geology, vegetation, agriculture, and cities. Additionally, access Landsat imagery from the last forty years to visualize how the Earth’s surface has changed over time.