Energy Access Viewer
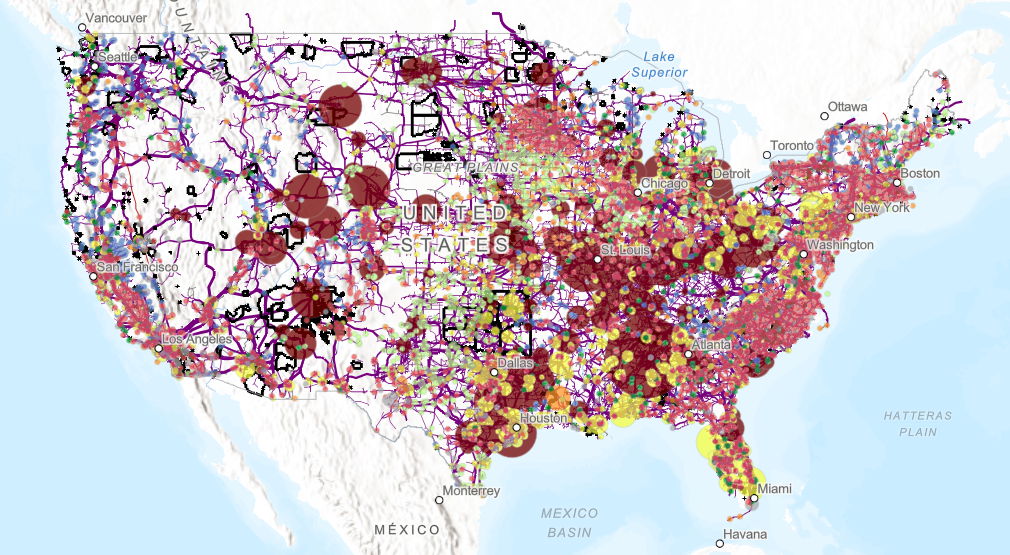
Explore detailed data on power plant emissions, energy generation, and infrastructure with our interactive dashboard. Specifically designed for US Native Lands, it provides insights into environmental impacts and energy dynamics in these regions.
Culvert Condition Viewer
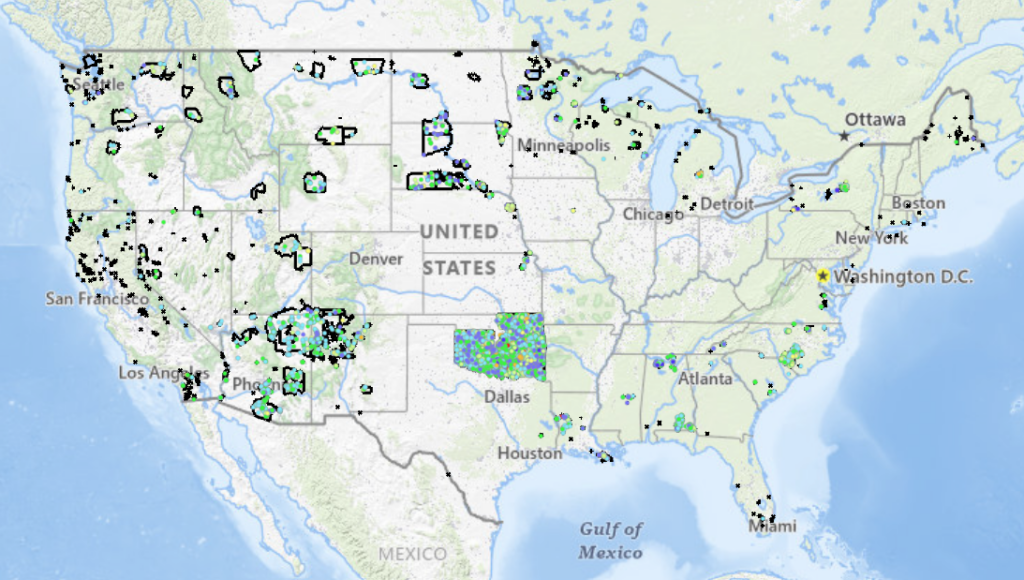
Explore Tribal Lands in the lower 48 states with this interactive map, showcasing culvert conditions and National Bridge Inventory (NBI) ratings to support environmental analysis and decision-making.
Climate Portal – External Links
Climate Data Portal External Links Other Organizations with Complimentary Climate Adaptation Information After exploring the resources available on our Climate Data Portal, you may want to dive deeper into specific areas of interest. To help guide your next steps, we’ve compiled a list of external organizations and resources that offer additional information and tools. While […]
Climate Portal – Additional Resources
Climate Data Portal Additional Resources PDFs Available for Download After utilizing the resources on our Climate Data Portal, you may want to explore additional information available on this page. We’ve compiled a collection of PDFs and documents that provide further insights and tools to support your climate adaptation planning. These resources complement what you’ve already […]
Tree Canopy Coverage Viewer
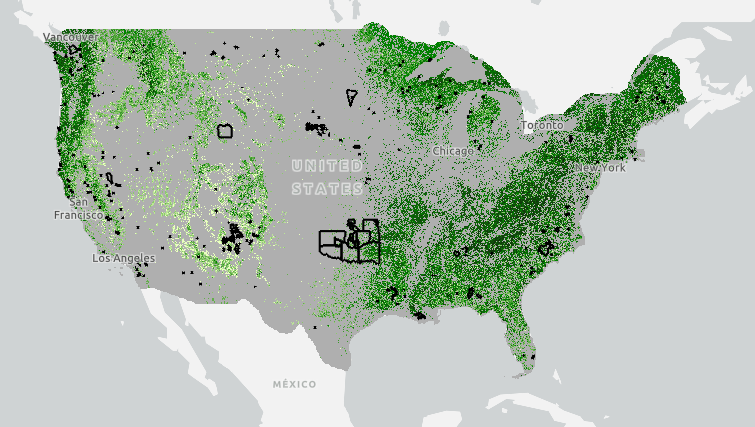
This viewer shows the canopy cover percentages in 2021 and changes in proportion of land surface covered by trees in the native lands across the United States.
Elevation Profile Explorer
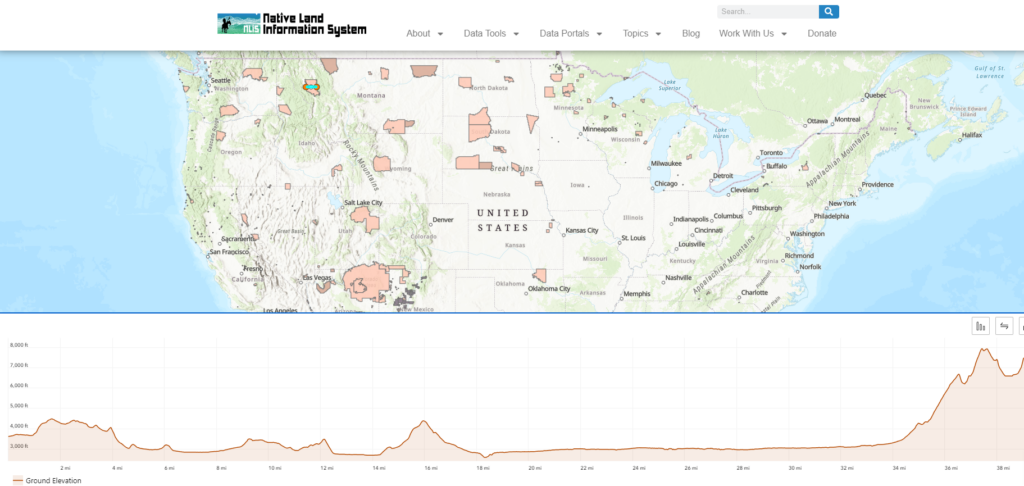
Welcome to the Elevation Profile Explorer, a powerful tool designed to help you understand the terrain and elevation changes across Native lands in the United States.
Climate Portal – Life
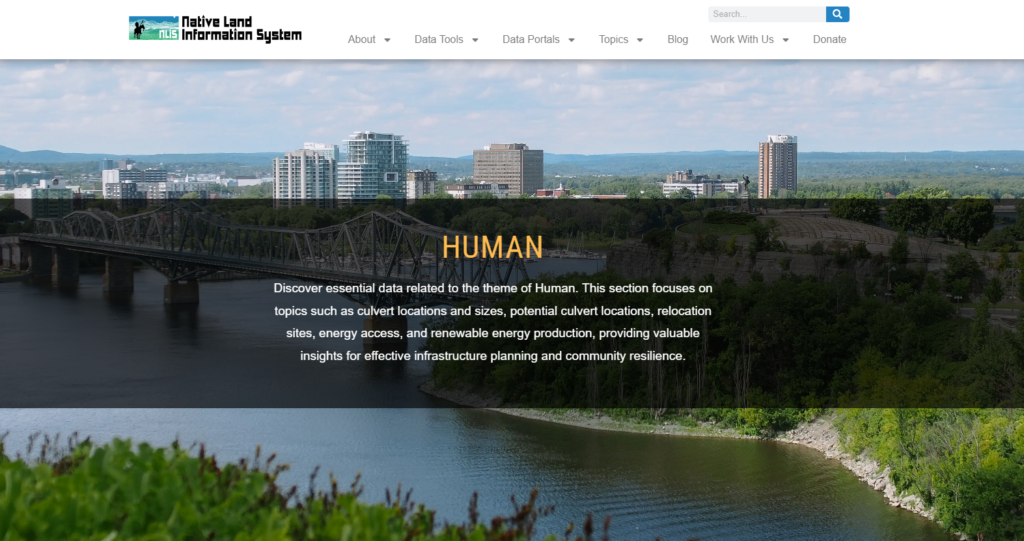
Life Discover essential data under the theme of Life, representing the interconnectedness of all elements—water, fire, air, and earth. This section provides insights on relocation sites, energy access, renewable energy, and infrastructure, emphasizing the Indigenous understanding of human stewardship as part of an interdependent system. Rooted in Traditional Ecological Knowledge, the Life theme supports culturally […]
Climate Portal – Water
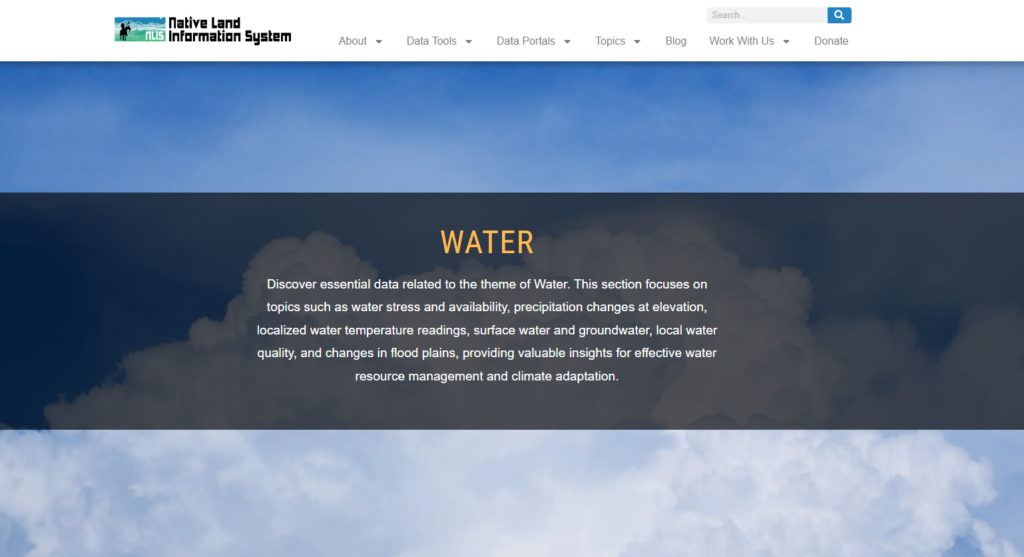
Water Discover essential data related to the theme of Water. This section focuses on topics such as water stress and availability, precipitation changes at elevation, localized water temperature readings, surface water and groundwater, local water quality, and changes in flood plains, providing valuable insights for effective water resource management and climate adaptation. The “Water” section […]
Climate Portal – Earth
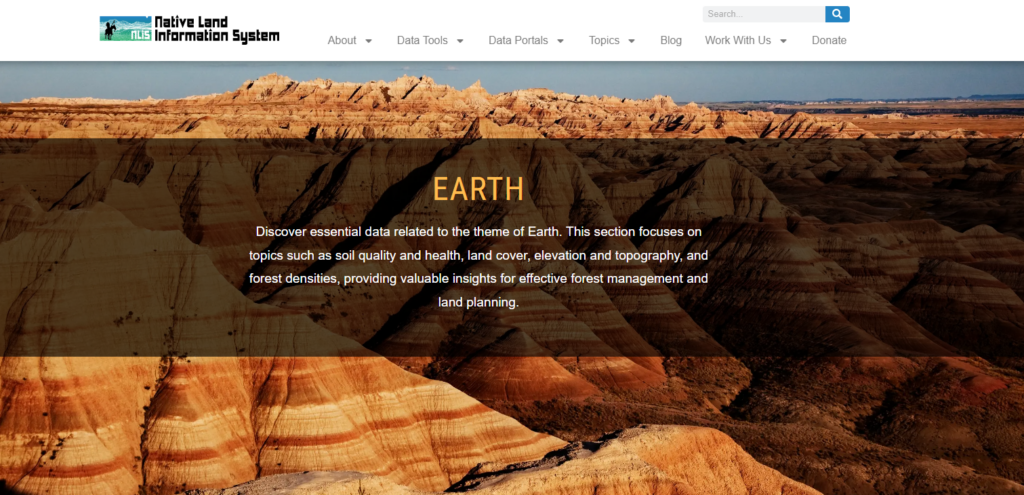
Earth Discover essential data related to the theme of Earth. This section focuses on topics such as soil quality and health, land cover, elevation and topography, and forest densities, providing valuable insights for effective forest management and land planning. The “Earth” section within the Environmental category provides comprehensive data, maps, and dashboards related to various […]
Introducing Our New Storymap: Good Fire: Mitigating Wildfire Risk & Healing Native Lands
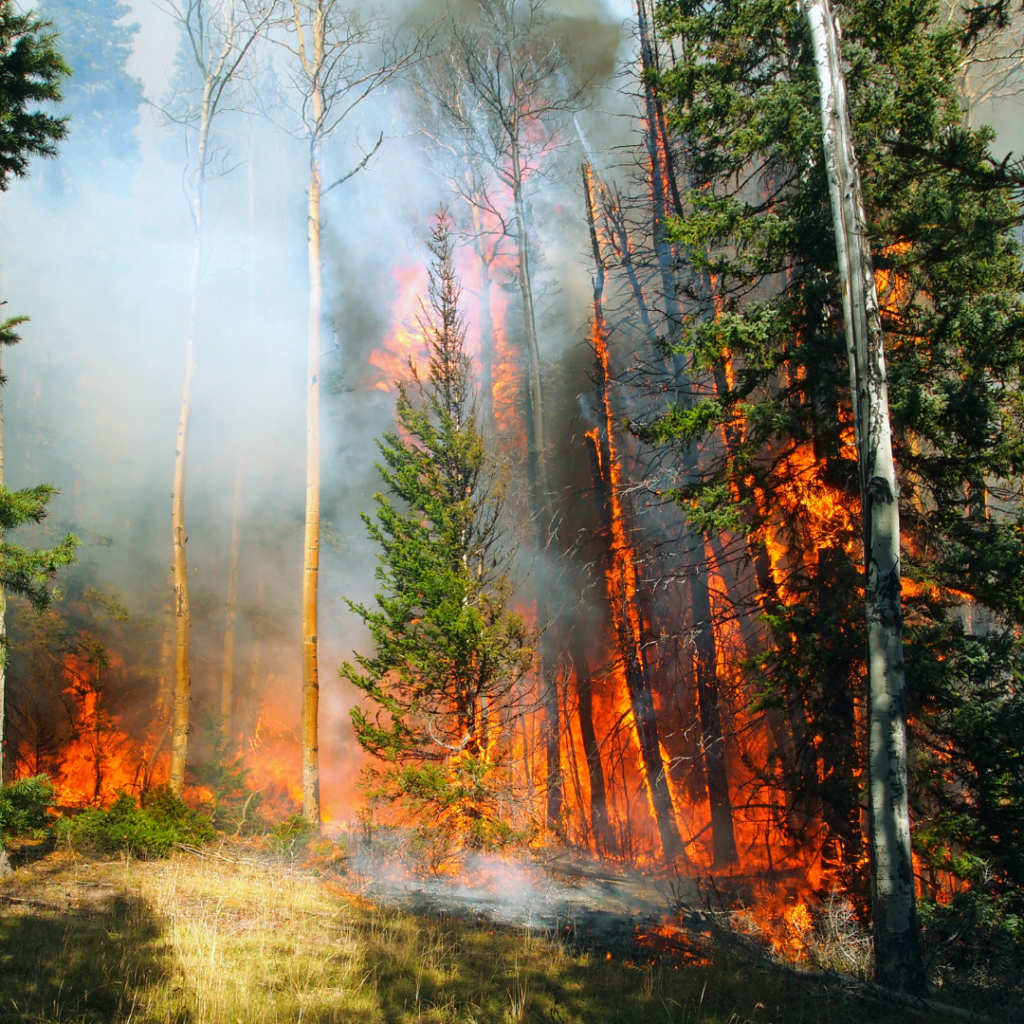
The Native Lands Advocacy Project is happy to announce our newest storymap: Good Fire: Mitigating Wildfire Risk & Healing Native Lands!
Good Fire: Mitigating Wildfire Risk & Healing Native Lands

After a long history of fire suppression in the United States, Native communities are reintroducing good fire to their lands.
Climate Portal – Air
Air Discover essential data related to the theme of Air. This section focuses on topics such as air quality, atmospheric data, climate projections, and wind and air current alterations, providing valuable insights for effective climate planning and adaptation. The “Air” section within the Environmental category provides comprehensive data, maps, and dashboards related to various atmospheric […]