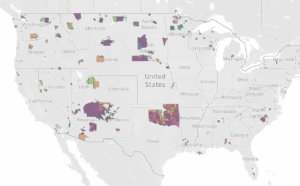
Our “What’s Growing on Native Lands?” Dashboard is now updated with the 2021 data from the United States Department of Agriculture’s (USDA) Cropland Data Layer, making our dashboard a more timely resource for Native land caretakers to use in monitoring the status of their homelands!
According to the the USDA, the Cropland Data Layer (CDL) is a:
raster, geo-referenced, crop-specific land cover data layer created annually for the continental United States. The CDL is created using moderate resolution satellite imagery and extensive agricultural ground truthing. The purpose of the Cropland Data Layer program is to use satellite imagery to provide acreage estimates to the Agricultural Statistics Board for major commodities and to produce digital, crop-specific, categorized geo-referenced output products.
United States Department of Agriculture (USDA)
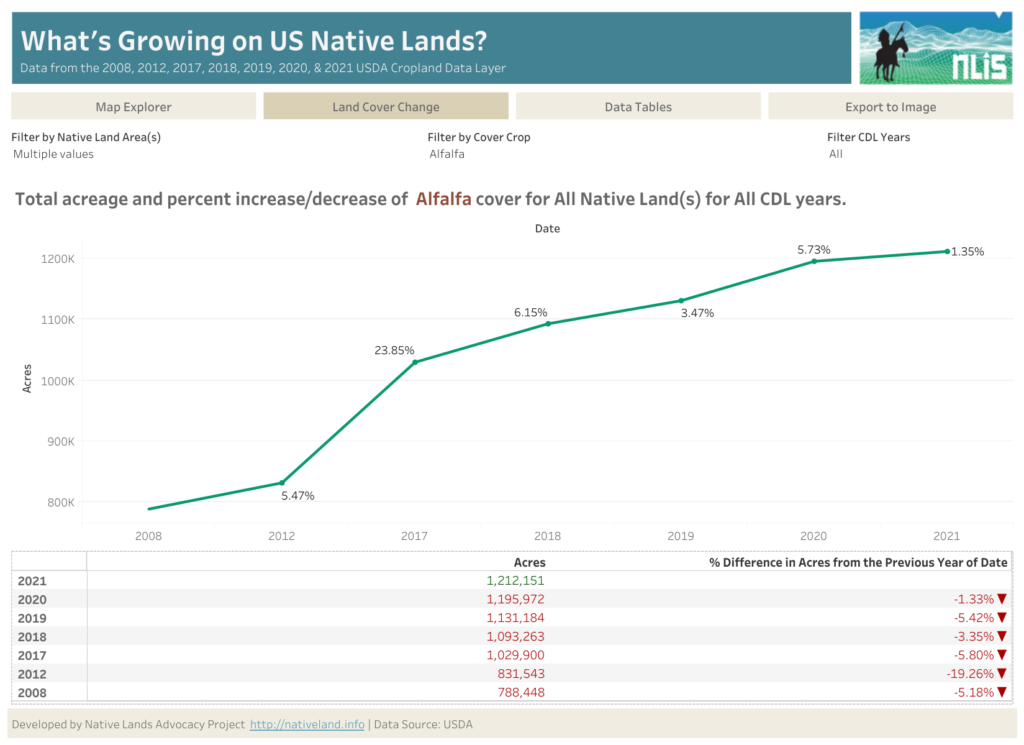
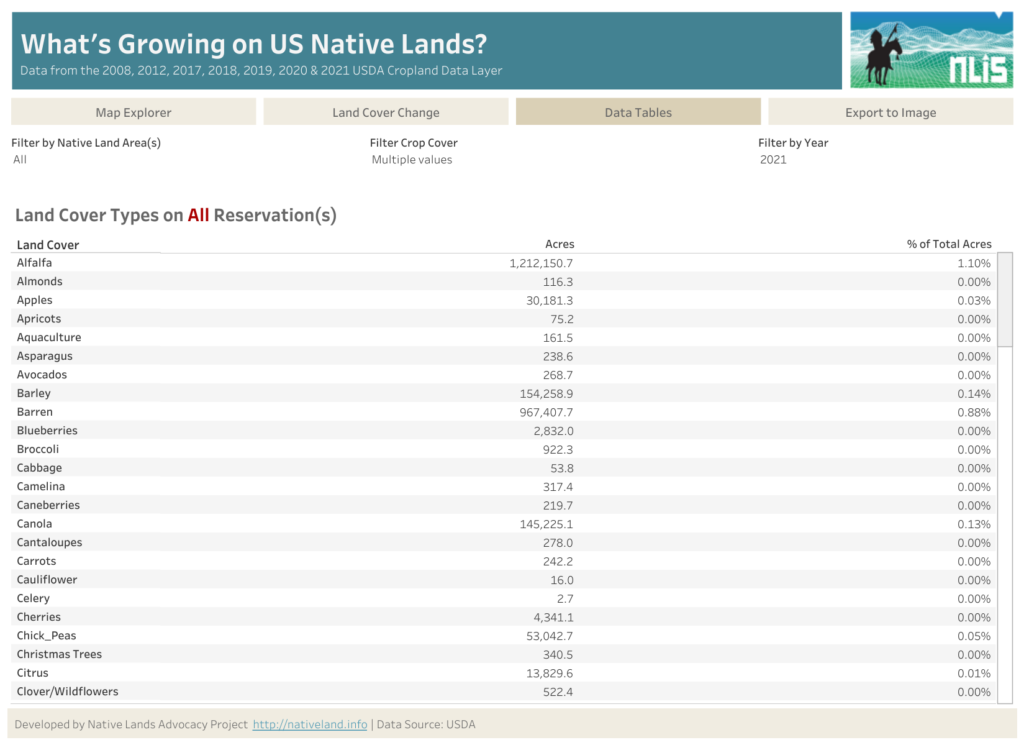
Using this data dashboard, you can:
- Filter the CDL data for one or more Native land areas for any of our dashboard features
- Analyze land cover change over time for specific crop types as well as total cover acreage and percent increase/decrease – since the CDL data has been collected since 1997, the new integration of the 2021 data makes the CDL a trusted tool for analyzing long-term land cover trends
- Access easy-to-read data tables for land cover acreage and percentages
- Observe agriculture productivity and crop variability over all CDL years
- Export chart images to be included in your own presentations and technical reports!
View the Status of Your Croplands for 2021!
View the most recent status of crop cover on your reservation using the interactive dashboard below. Visit our dashboard page to learn more!

