In the summer of 2023, the Native Lands Advocacy Project developed a Historic Loss Assessment—articulating lost lives, lands, and resources for the Native Nations of Colorado—for the Truth, Restoration, and Education Commission (TREC) of the People of the Sacred Land. The findings of the TREC can be viewed here in three comprehensive reports.
NLAP was honored to be included in this work, and in the process of developing the Historic Loss Assessment, our team came to realize the power these tools have for correcting historically harmful narratives and advocating for true and equitable pathways forward. This series of blog posts (start here) outlines some of the processes and data tools NLAP developed to complete this assessment. This series is not a comprehensive review of the final TREC assessment; rather, through these posts, we aim to promote the usefulness of such a tool so that these assessments may be completed in more states.
This blog post covers two sections of a Historic Loss Assessment:
The previous post in this series outlines the various ways the final Historic Loss Assessment mapped and quantified land loss for the Native Nations of Colorado. In this post, we walk through the next two sections of the assessment: Loss of Life and Extraction of Minerals.
Loss of Life
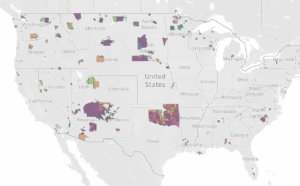
NLAP developed the Indian Wars Casualty Database (IWCD) dashboard to visually represent casualties from violent incidents between Indigenous peoples and state/federal militaries, cavalries, and volunteer cavalries. The IWCD was created by geolocating incidents listed in a public dataset by Colin S. Gillespie, and the dataset itself is a composite of multiple sources documenting conflicts between settlers and Indigenous peoples. The full dashboard for the IWCD is not publicly available on our website due to the sensitivity of what it represents, but access to it can be requested privately. To view IWCD data for Colorado specifically, see pages 50-65 of the Historic Loss Assessment.
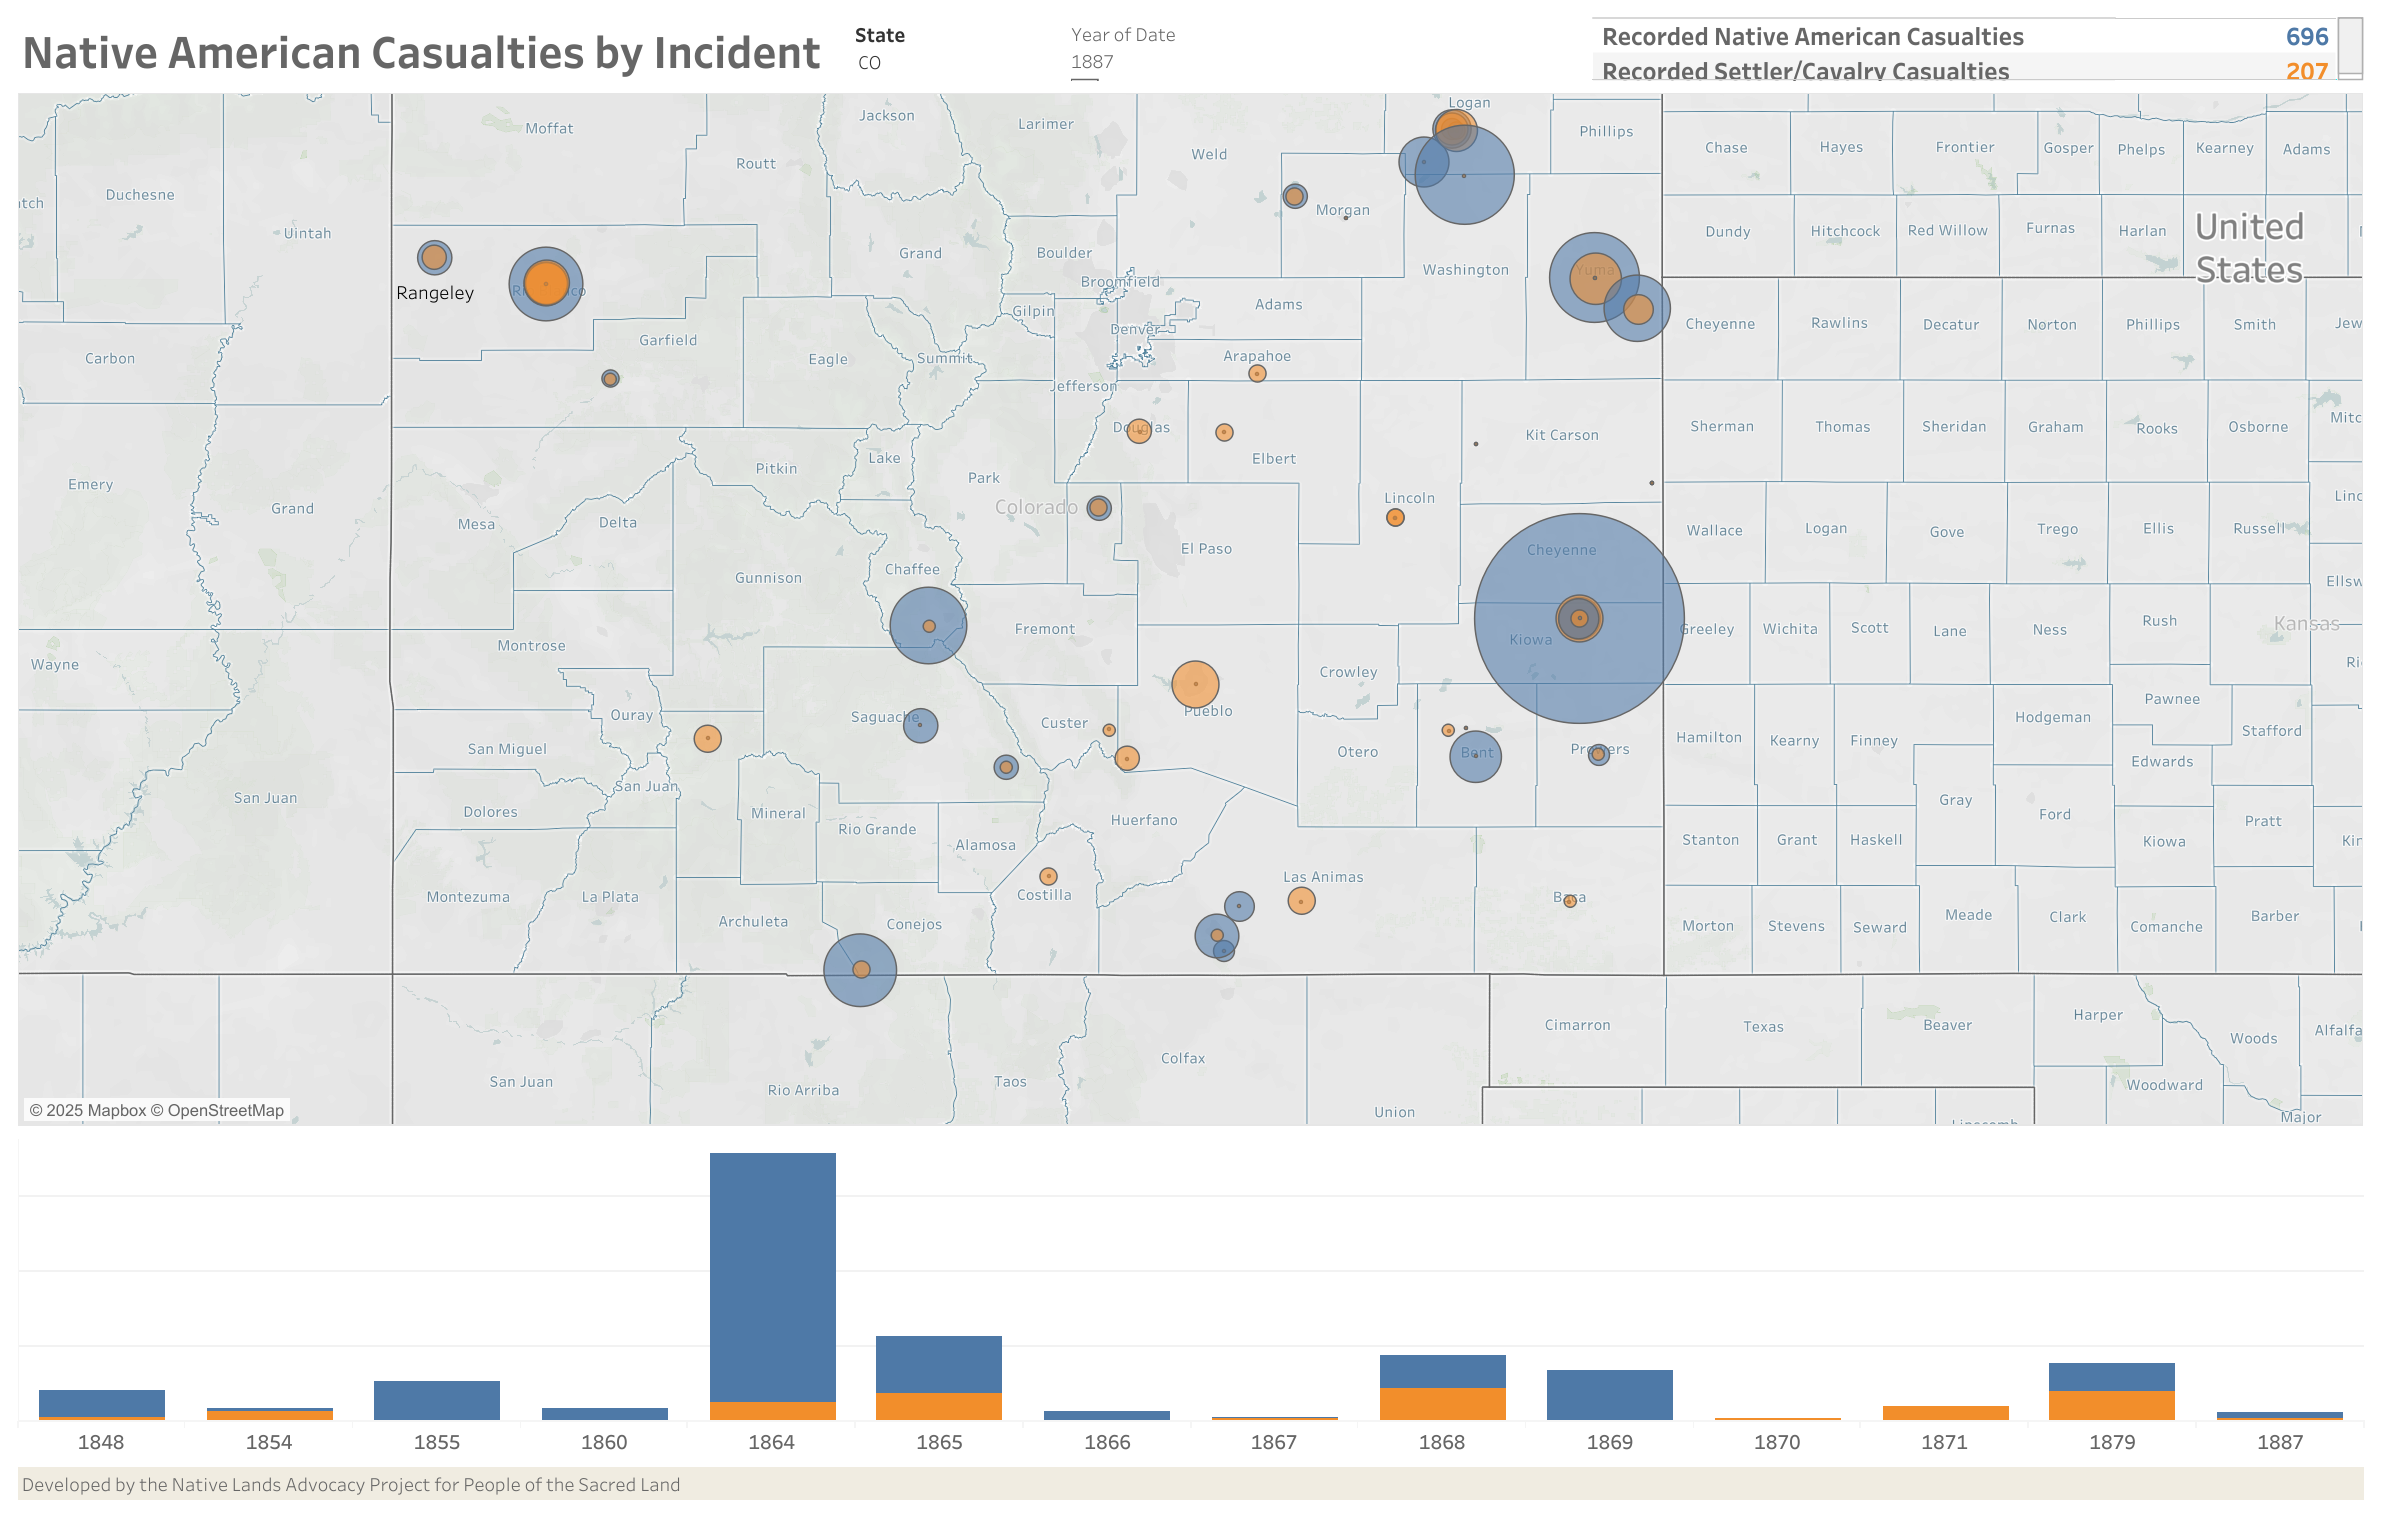
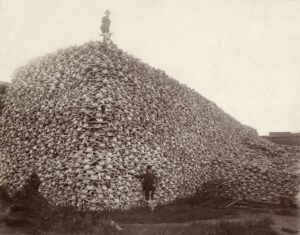
The IWCD reveals a powerful counter-narrative of the bloody years of colonization. Settlers were invested in creating a narrative that painted Native peoples as murderous, lawless, and unreasonable. This narrative helped “justify” policies of systematic relocation and annihilation, and unfortunately still has enduring power in the U.S. today.
However, the IWCD shows that it was not settlers but Natives who consistently experienced the most losses in these violent years. In Colorado, the IWCD shows 696 Native casualties and 207 non-Native casualties*—and this does not even take into account losses from starvation, illness, forced relocation, etc. This data is therefore both validating to the lived experiences of these Native communities and valuable for educating against harmful historical narratives.
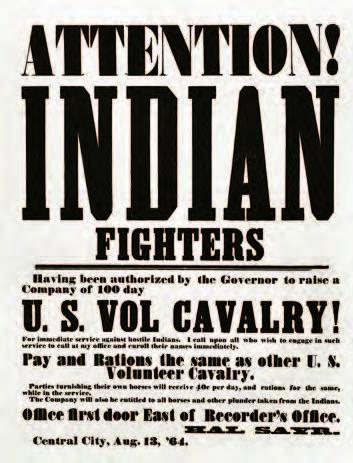
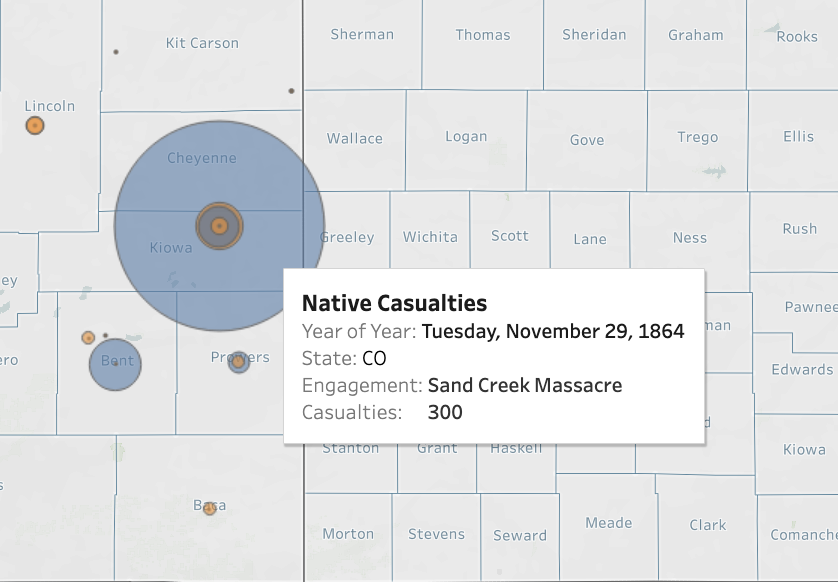
These data can be presented alongside historical context to paint a fuller picture of the colonial project. The Historic Loss Assessment for Colorado found that the violent incidents logged in the IWCD were almost always preceded by settler encroachment on unceded Native lands as well as mineral extraction from those unceded lands. In the case of these two images, Governor John Evans’ Proclamation authorizing all Colorado citizens to “kill and destroy, as enemies of the country,” the Natives of Colorado was one of many factors that led to the tragedy of the Sand Creek Massacre.
*While there is power in this data, it is vital to note that the numbers in the IWCD are not mere statistics. Each number represents a loved one whose loss has enduring effects into the present day. Moreover, these losses taken together represent the collective efforts of settlers to eradicate Indigenous peoples from their homelands.
Extraction of Minerals
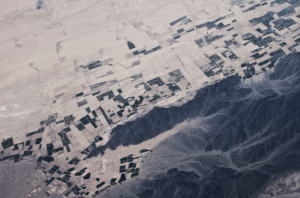
Colorado was home to one of the United States’ major gold rushes, and resource/mineral extractivism was a major motivator for encroaching upon, and eventually taking, Native lands. To calculate mineral extraction for the TREC, NLAP drew upon various mining data sources (detailed below) to quantify the monetary gains made by settlers through this mining. As with many of the studies conducted in this Historic Loss Assessment, the goal was to calculate a numeric value for the losses experienced by Native communities (and, conversely, the gains reaped by settlers).
Because of this, this section does not take into account the manifold other ways mineral extraction impacted tribal communities, including:
- Disruption of cultural relationships: Native communities knew of, and had pre-existing relationships with, the various mineral resources on their lands. Settler extraction of these minerals does not just represent unequal profits, but rather a disruption to Indigenous ways of life.
.
- Destruction of balanced ecosystems: Mining is an inherently destructive and invasive process, and it continues to impact the surrounding land, water, atmosphere, flora, and fauna long after sites have been abandoned. Quantifying the lasting ecological damages caused by mining in Colorado was outside the scope of this assessment, but would be a valuable avenue for further research.
Because there wasn’t one comprehensive source of data related to historic mineral extraction in Colorado, NLAP developed three separate dashboards drawing from various sources and covering different periods of time. From these data, we then developed a composite dashboard. Read on to learn more about the dashboards and their data sources below.
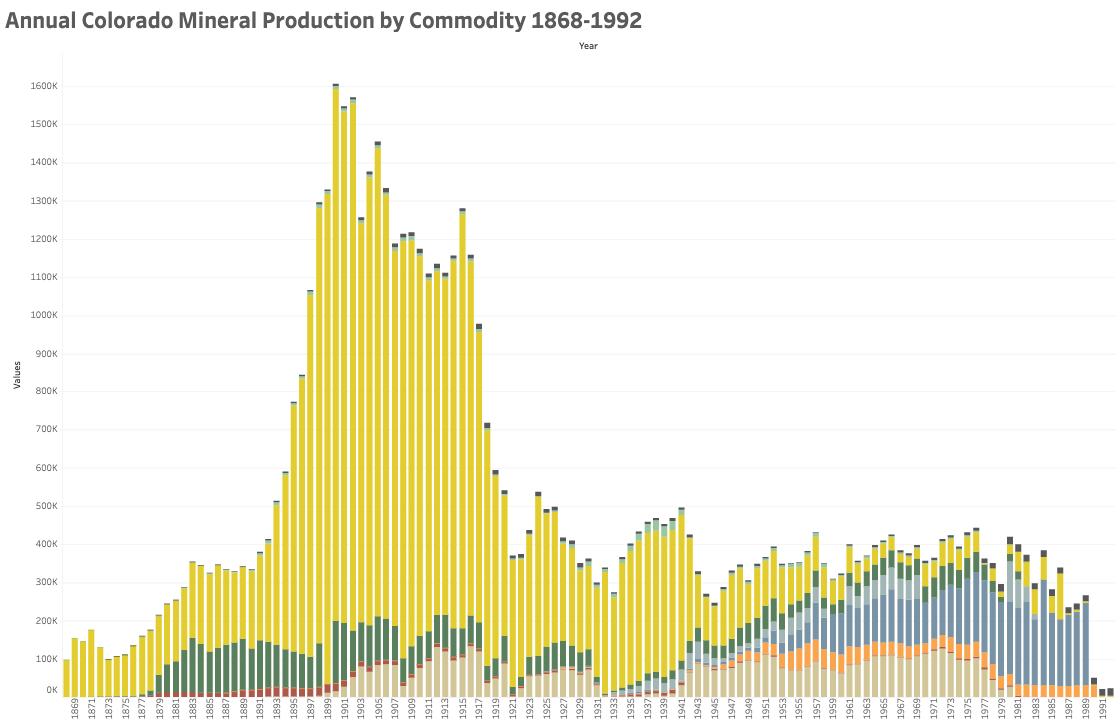
Historical Statistics of Mining in Colorado, 1869-1992
In 1996, the Mining History Journal published an article by Eric E. Stene containing Annual Mineral Production statistics for Colorado from 1868-1993. NLAP tabulated these values and developed the dashboard below, which is featured on pages 73-74 of the Historic Loss Assessment. This dashboard can be filtered for year(s) and/or specific minerals.
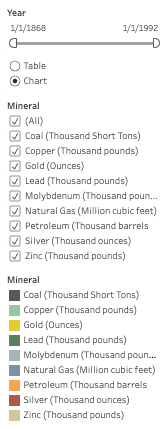
Features to note regarding this dashboard/data include:
- These minerals are represented by their quantities, which are measured differently depending on the mineral. For example, gold is measured in ounces, while lead is measured in thousand pounds.
- Limited scope: While this data spans over a hundred years, it only reports production amounts for nine minerals: coal, copper, gold, lead, molybdenum, natural gas, petroleum, silver, and zinc. Therefore, this data paints a very important picture of Colorado’s mineral extraction from 1868-1992, but an incomplete picture nonetheless.
From this dashboard, the TREC reports the following summary data for mineral extraction in Colorado from 1869-1992:
Mineral | Quantity | Measurement Unit |
|---|---|---|
Coal | 875,926 | thousand short tons |
Copper | 657,188* | thousand pounds |
Gold | 40,543,006 | ounces |
Lead | 6,255,410* | thousand pounds |
Molybdenum | 1,313,027* | thousand pounds |
Natural Gas | 5,324,264* | million cubic feet |
Petroleum | 1,597,355 | thousand barrels |
Silver | 834,149* | thousand ounces |
Zinc | 5,697,600* | thousand ounces |
*This total is affected by values being withheld for proprietary reasons multiple years in this time range. Therefore, the actual production amount is higher than this number.
Minerals Data from the Department of the Interior, 1858-1923
In 1926, the Department of the Interior’s U.S. Geological Survey (USGS) published a report titled Mining in Colorado: a History of Discovery, Development, and Production by Charles W. Henderson. NLAP tabulated these values and developed the dashboard below, which is featured on pages 74-76 of the Historic Loss Assessment. This dashboard can be filtered for county, year(s), and/or specific minerals.
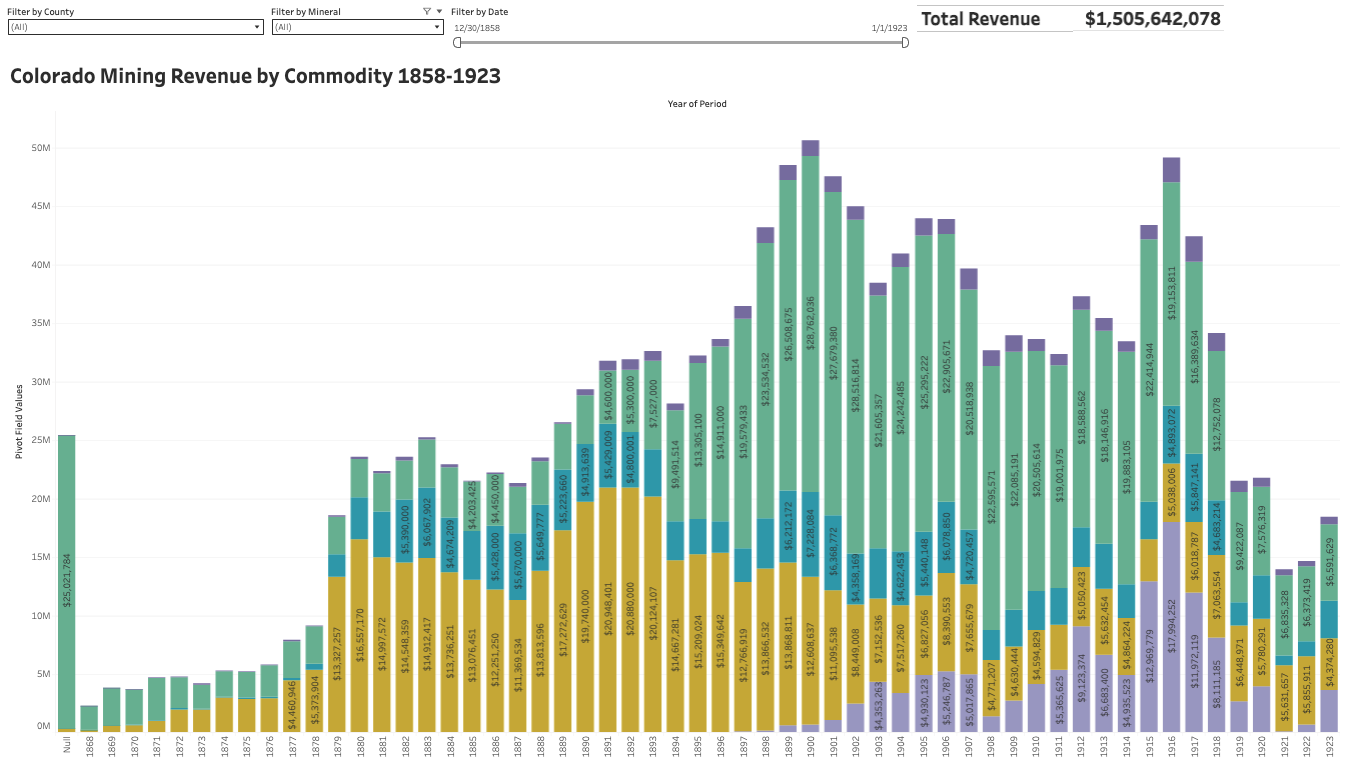
Features to note regarding this dashboard/data include:
- Unlike the other data sources used in this section, this report presents data from each county in Colorado, allowing for a high level of detail and exploration.
- This report provides the value of each year’s mineral extractions (rather than just the production quantities, like the data found in Stene’s article).
- Similar to the previous dashboard, this data is limited in which minerals it represents; it only shows data for copper, gold, lead, silver, and zinc values.
From this dashboard, the TREC reports the following summary data for mineral extraction in Colorado from 1858-1923:
Mineral | Value |
|---|---|
Copper | $40,674,150 |
Gold | $648,548,636 |
Lead | $189,662,198 |
Silver | $501,494,302 |
Zinc | $125,262,792 |
Based on the data published by the USGS, between 1858 and 1923, $1,505,642,078 in these five minerals were extracted from Colorado.
USGS Minerals Yearbooks, 1934-2019
The USGS has published annual minerals yearbooks since the 1930s. NLAP tabulated the values from these yearbooks and developed the dashboard below, which is featured on pages 77-78 of the Historic Loss Assessment. This dashboard can be filtered for year(s) and/or specific minerals.
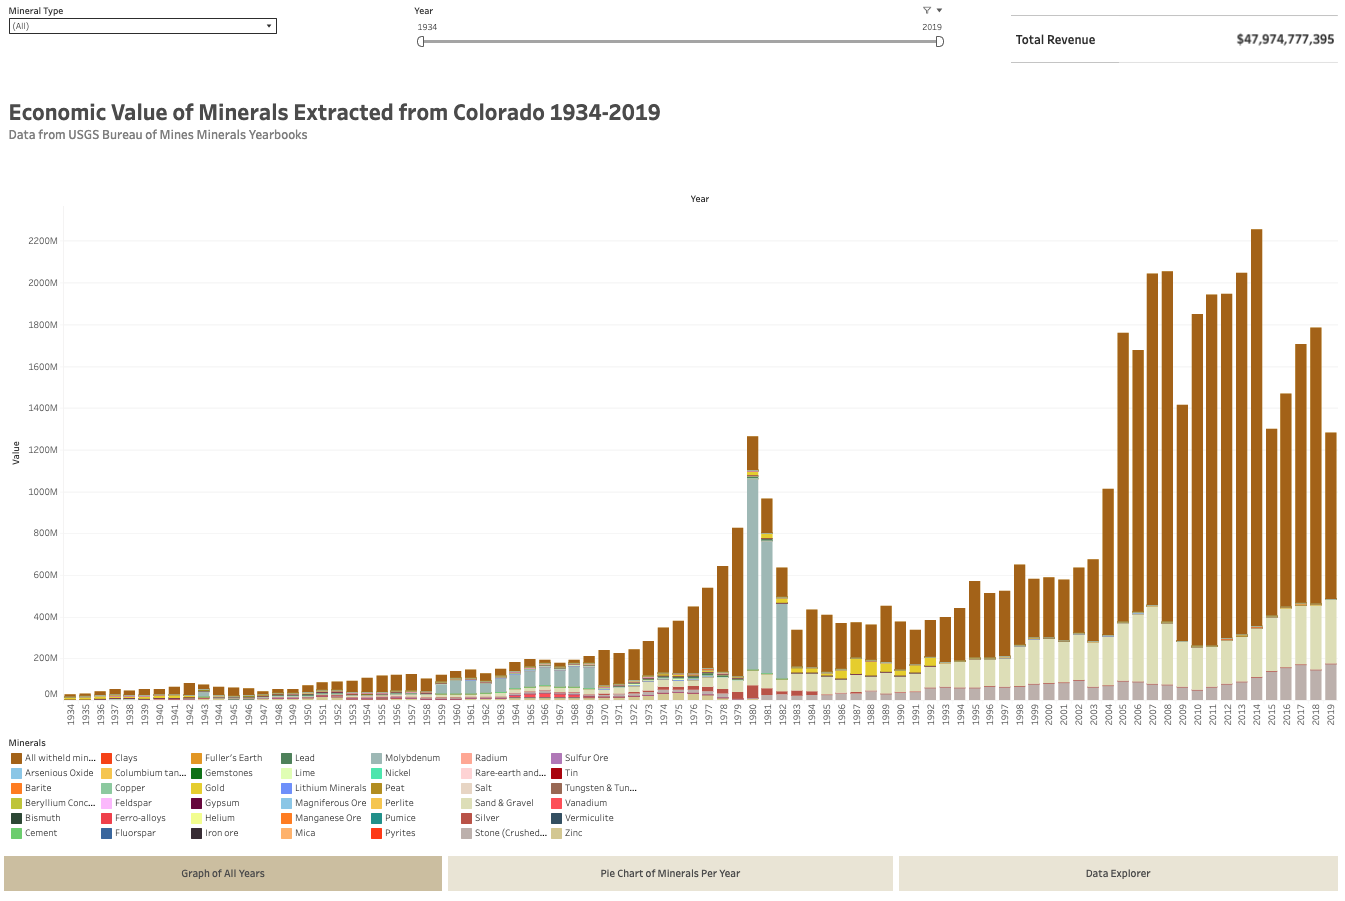
Features to note regarding this dashboard/data include:
- This dashboard only includes values for nonfuel minerals.
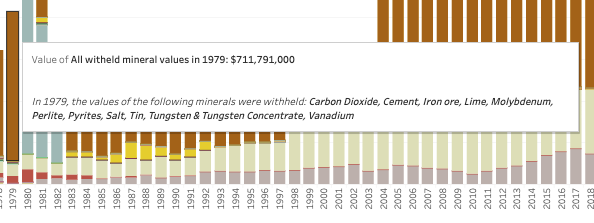
- Some values are withheld from the USGS yearbooks because they are considered proprietary; these withheld values are then given as a lump sum. In this dashboard, that lump sum is titled “All withheld mineral values.”
- In the interactive dashboard, viewers can see which mineral values were withheld by hovering over the chart (example below).
- This dashboard visualizes 41 different nonfuel minerals and therefore shows a more complete picture of Colorado’s mineral extraction in the last century. However, the prevalence of withheld values in the data makes it difficult to know exactly how much of certain minerals have been extracted.
According to the data from the mineral yearbooks, between 1934 and 2019, at least $47,974,777,395 of nonfuel minerals have been extracted from Colorado.
Combined Mineral Value Data: 1858-2022
Using the above data sources, NLAP compiled a composite dashboard of mineral extraction in Colorado. This composite dashboard is featured on pages 78-80 of the Historic Loss Assessment. Specifically, the dashboard displays data as follows:
- Nonfuel mineral data for 1858-1923: Taken from Henderson’s USGS report. In this composite dashboard, values have been adjusted for inflation.
- Nonfuel mineral data for 1934-2019: Taken from the USGS Annual Minerals Yearbooks. In this composite dashboard, values have been adjusted for inflation.
- Fuel mineral data for 1868-1993: Calculated using the production data from Eric E. Stene and combined with commodity values for each year from several sources. (More information about these sources and values can be found in Appendix H of the full, final assessment).
- Fuel mineral data for 1994-2022: Also derived from several sources; these are listed in Appendix I of the full, final assessment.
- Finally, note the gaps that still appear in this data. Any limitations of the individual datasets apply here, too (such as Henderson’s report only containing data for five nonfuel minerals). Also, from 1924-1933, NLAP could not locate nonfuel mineral data, so the only data for these years is fuel data. Similarly, from 2020-2022, the USGS Minerals Yearbooks have not yet been released, so the only data is fuel values. This means the actual grand total value of mineral extraction in these years is higher than the total calculated in this dashboard.
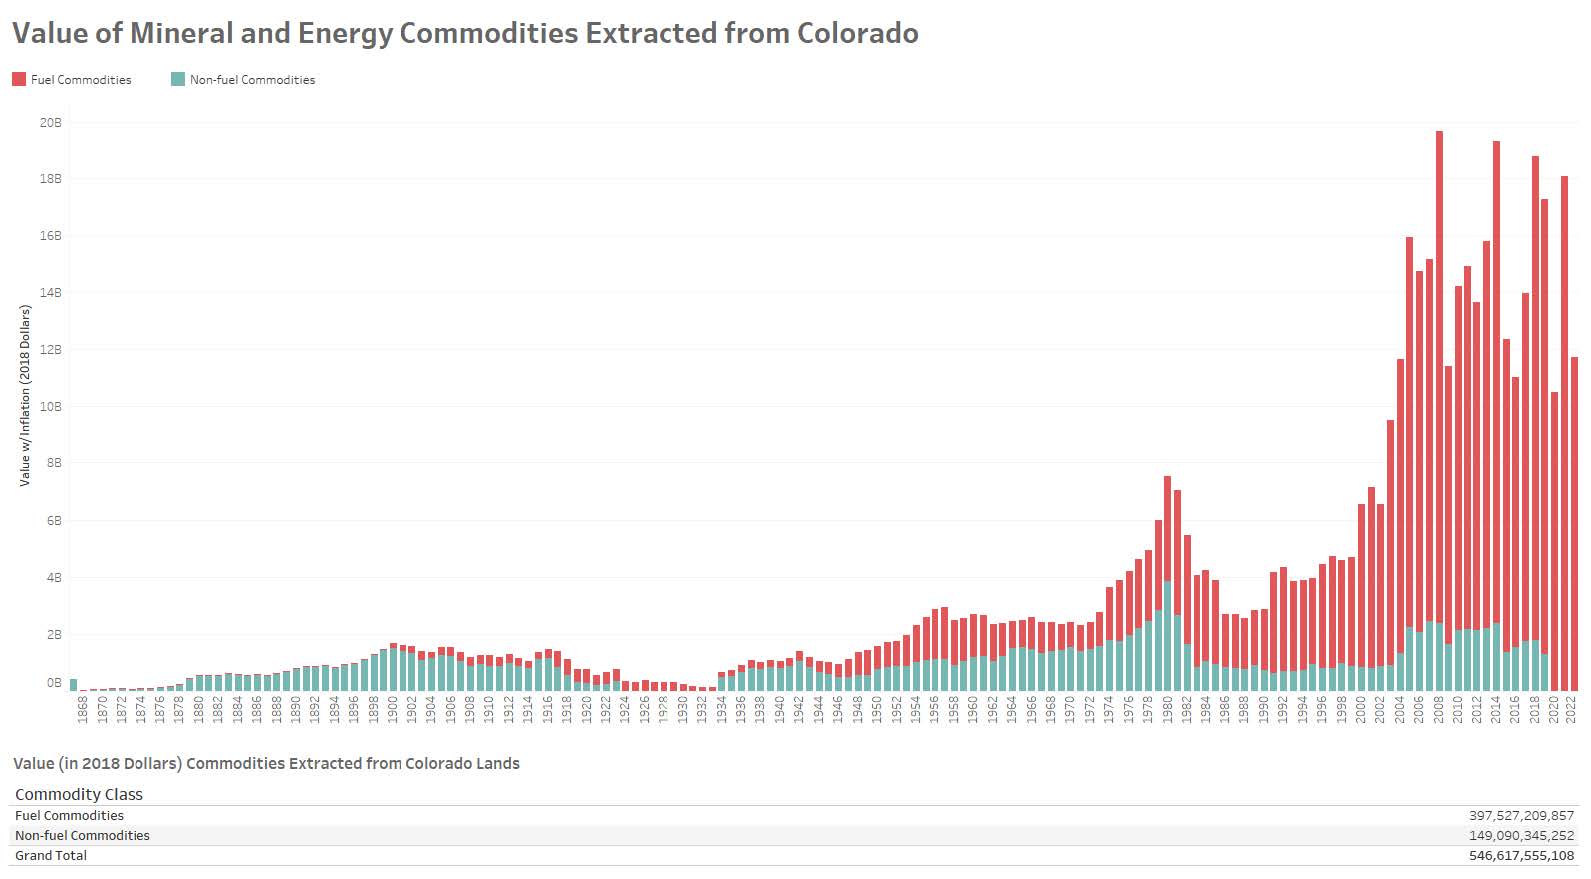
The Historic Loss Assessment calculates that over $546,617,555,108 (in 2018 dollars) of value in minerals have been extracted from Colorado since 1858.
NLAP hopes to one day create a database of extracted minerals for all states. Developing this Historic Loss Assessment for the Native Nations of Colorado allowed our team to explore the data sources available (and the level of effort required) to replicate these studies nationwide.
Also, depending on the state, creators of a Historic Loss Assessment can also consider the extraction of other resources from Native lands—timber, furs, etc.—and how the extraction of these resources contributed to the removal of Native peoples from their lands.
This blog post is part of a series that documents our processes in creating a Historic Loss Assessment for the Truth, Restoration, and Education Commission (TREC) of the People of the Sacred Land. To view the landing page for the rest of the series, click here.
Author
Written by Emma Scheerer