The Native Lands Advocacy Project is happy to announce the beta launch of our interactive data dashboard for the 2012 and 2017 Census of Agriculture for American Indian Reservations. The Census of Agriculture for American Indian Reservations represents the most complete source of data on agricultural producers and farms on American Indian Reservations. This dashboard enables unprecedented access to this data by not only presenting the raw numbers but also making it possible to group some or all included reservations, see the distribution of key variables across reservations, compare change across time, and compare producer characteristics and access between Native and non-Native farmers and ranchers.
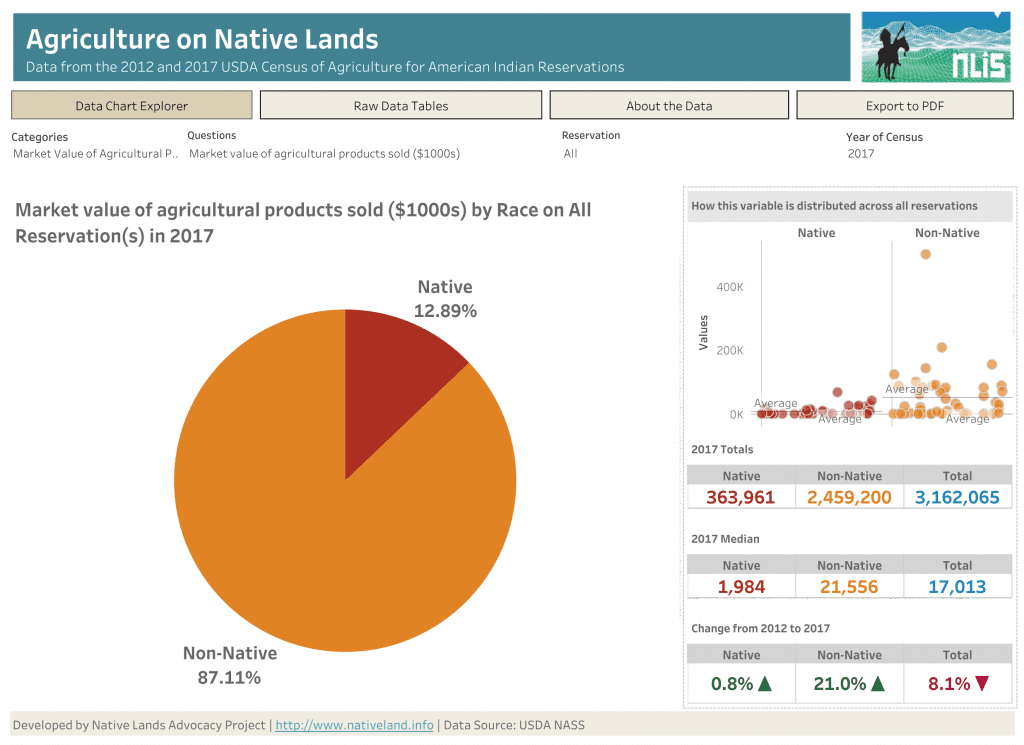
Screenshot of NLIS Census of Agriculture Dashboard
About the USDA Census of Ag for American Indian Reservations
In 2002, the USDA began conducting a special Census for agriculture on American Indian Reservations. The first year was only a pilot study that included reservations in Montana, South Dakota, and North Dakota; this expanded in 2007 and 2012. The 2012 Census included data for only 76 reservations, and the 2017 Census included data for only 73. The Census for American Indian Reservations includes all farms and ranches within the boundaries of the included reservations, but it does not distinguish between farmers and ranchers operating on trust land or those operating in fee or deeded lands.
The published Census only quantifies each variable for “Native” and “Reservation Total” and does not report statistics for “Non-Native,” which makes it difficult to understand the extreme disparity that exists between Native and non-Native producers operating on reservation lands. While we have submitted a special tabulation request to the USDA NASS for the data on non-Native operators, in the meantime, we’ve included a provisional calculation for non-Native producers, making it possible to analyze the racial disparity in agriculture on Native lands. Additionally, the way the data is presented by the USDA makes it difficult to aggregate the total data for all reservations, which is useful for understanding the national statistics. This new dashboard makes this calculation possible.
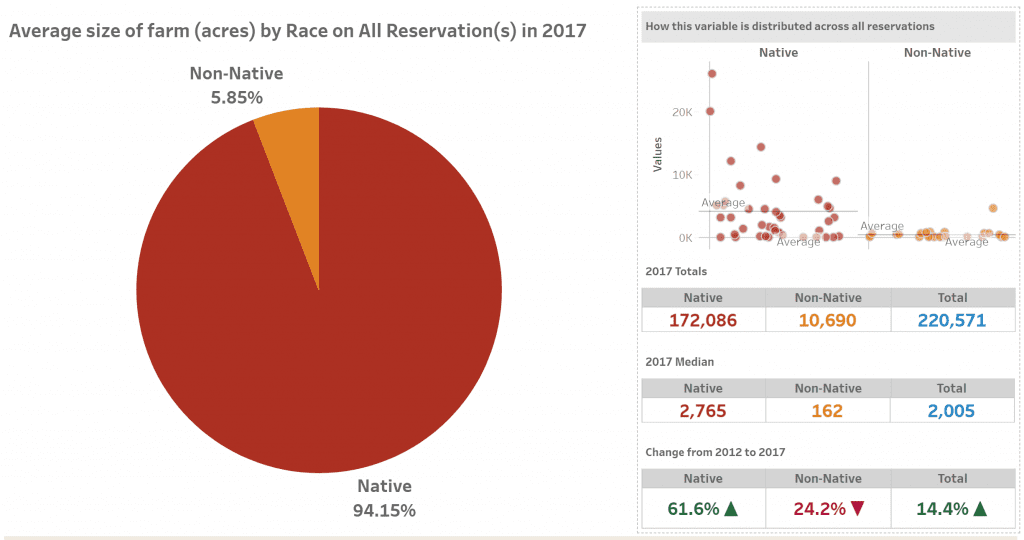
The dashboard includes filters for reservation, census year, and variable in the census. Data can be viewed in pie chart (on the left in the image above) and in a jitter plot (on the right in the image above) which shows the distribution of each variable across all reservations by race. Charts below the jitter plot also show the total and median for each variable broken down by Native vs. non-Native, and the percent change between 2012 and 2017 with helpful up and down arrows as a visual shorthand.
For those who’d like to access the dataset (cleaned and formatted by NLAP), it’s available for download on our data portal.