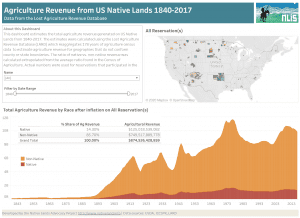
Quantifying Disparities in Agricultural Revenue on Native Lands
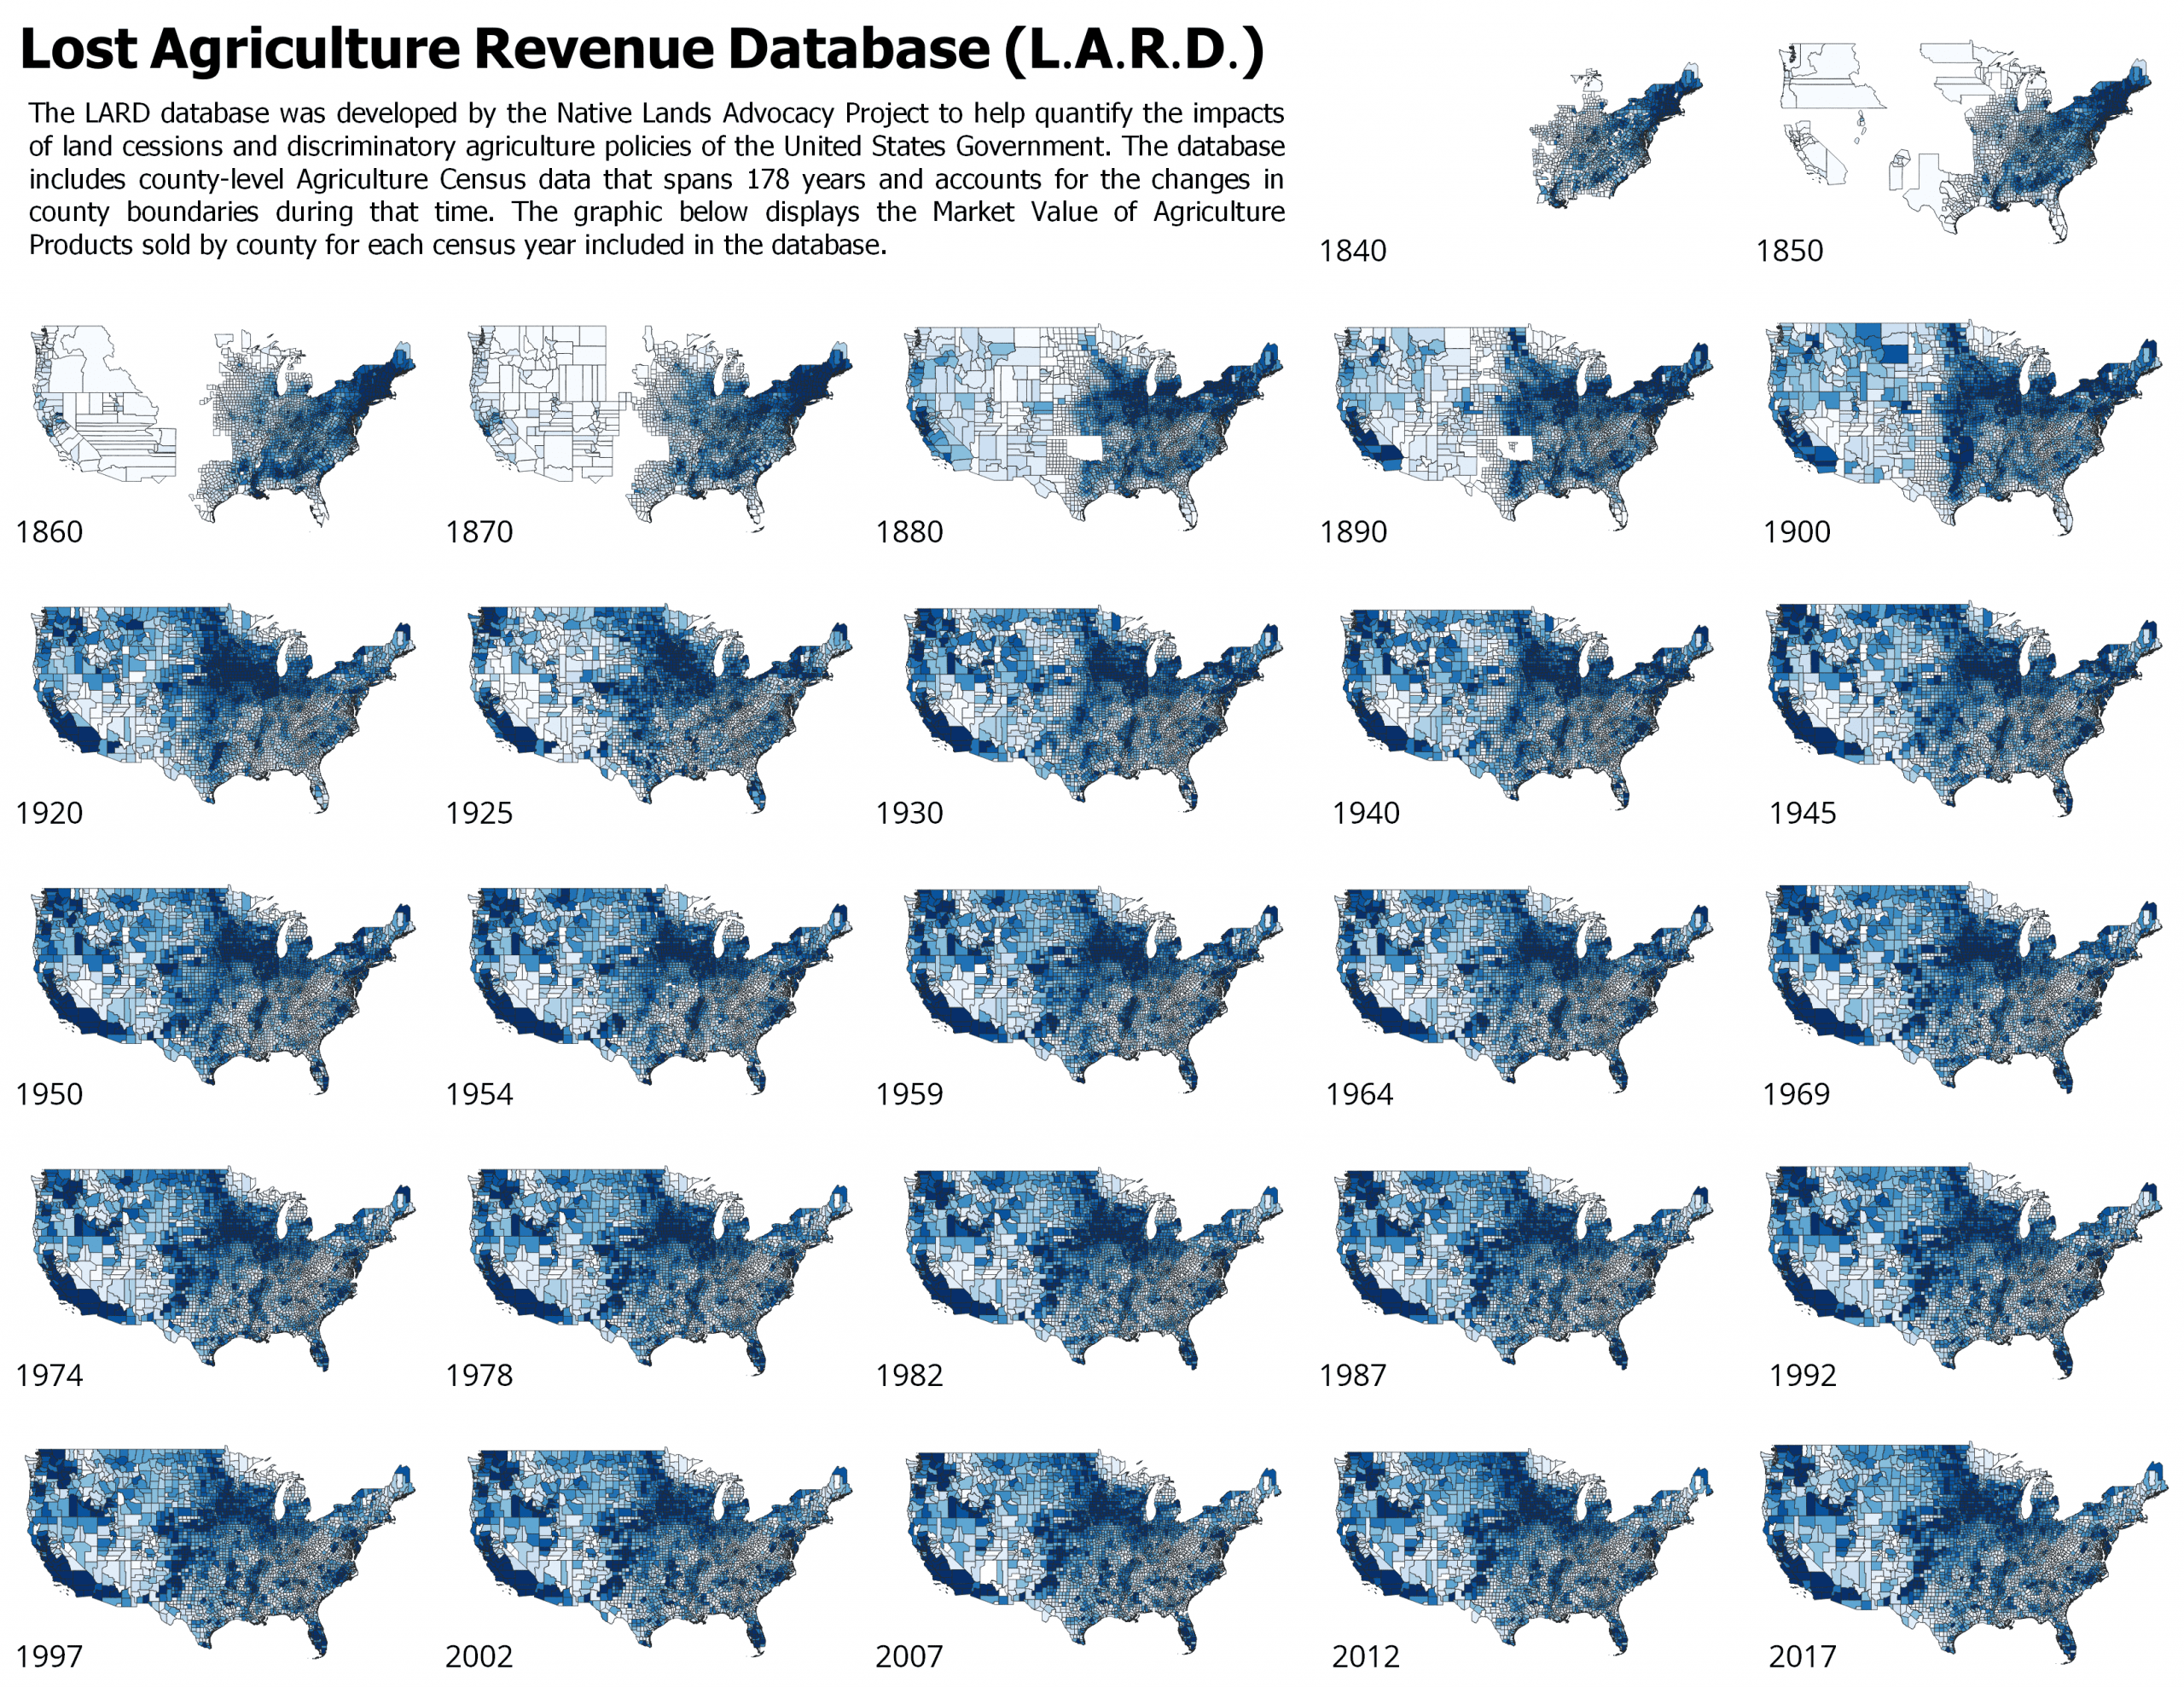
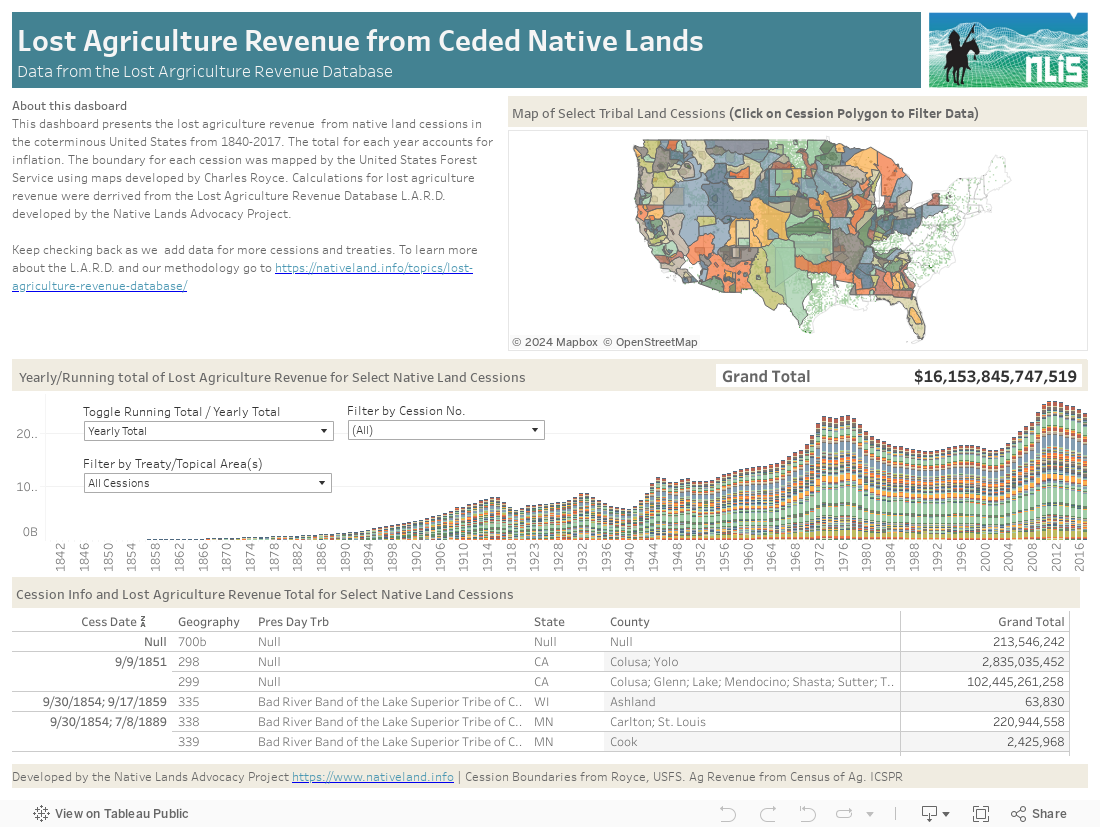
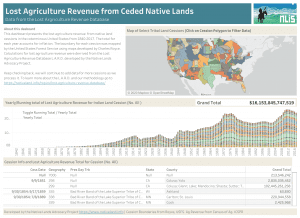
According to our Lost Agriculture Revenue Database, non-Native farmers have made $749,517,889,778 in agricultural revenue (85.7% of total revenue) on Native reservations since 1840, while Native farmers have made $125,018,539,082 (14.3% of total revenue). What factors contribute to this shocking disparity in agricultural revenue? And what do these numbers really represent for Native communities?
NLAP Presents Lost Agriculture Revenue Database to Oceti Sakowin Titunwan Lakota Oyate Treaty Conference – 12/16/2021
David Bartecchi, Director of Village Earth and its Native Lands Advocacy Project (NLAP), had the honor to present the project’s Lost Agriculture Revenue Database (LARD)
How Much Discriminatory Lending Practices Impact Agricultural Revenue on US Native Land
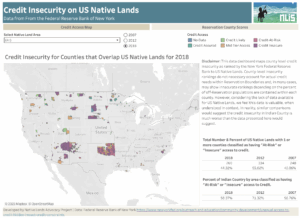
By Aude K. Chesnais Introduction: Lending and Debt on US Native Land In 2018, the Keepseagle settlement shed light on widespread lending discrimination across the
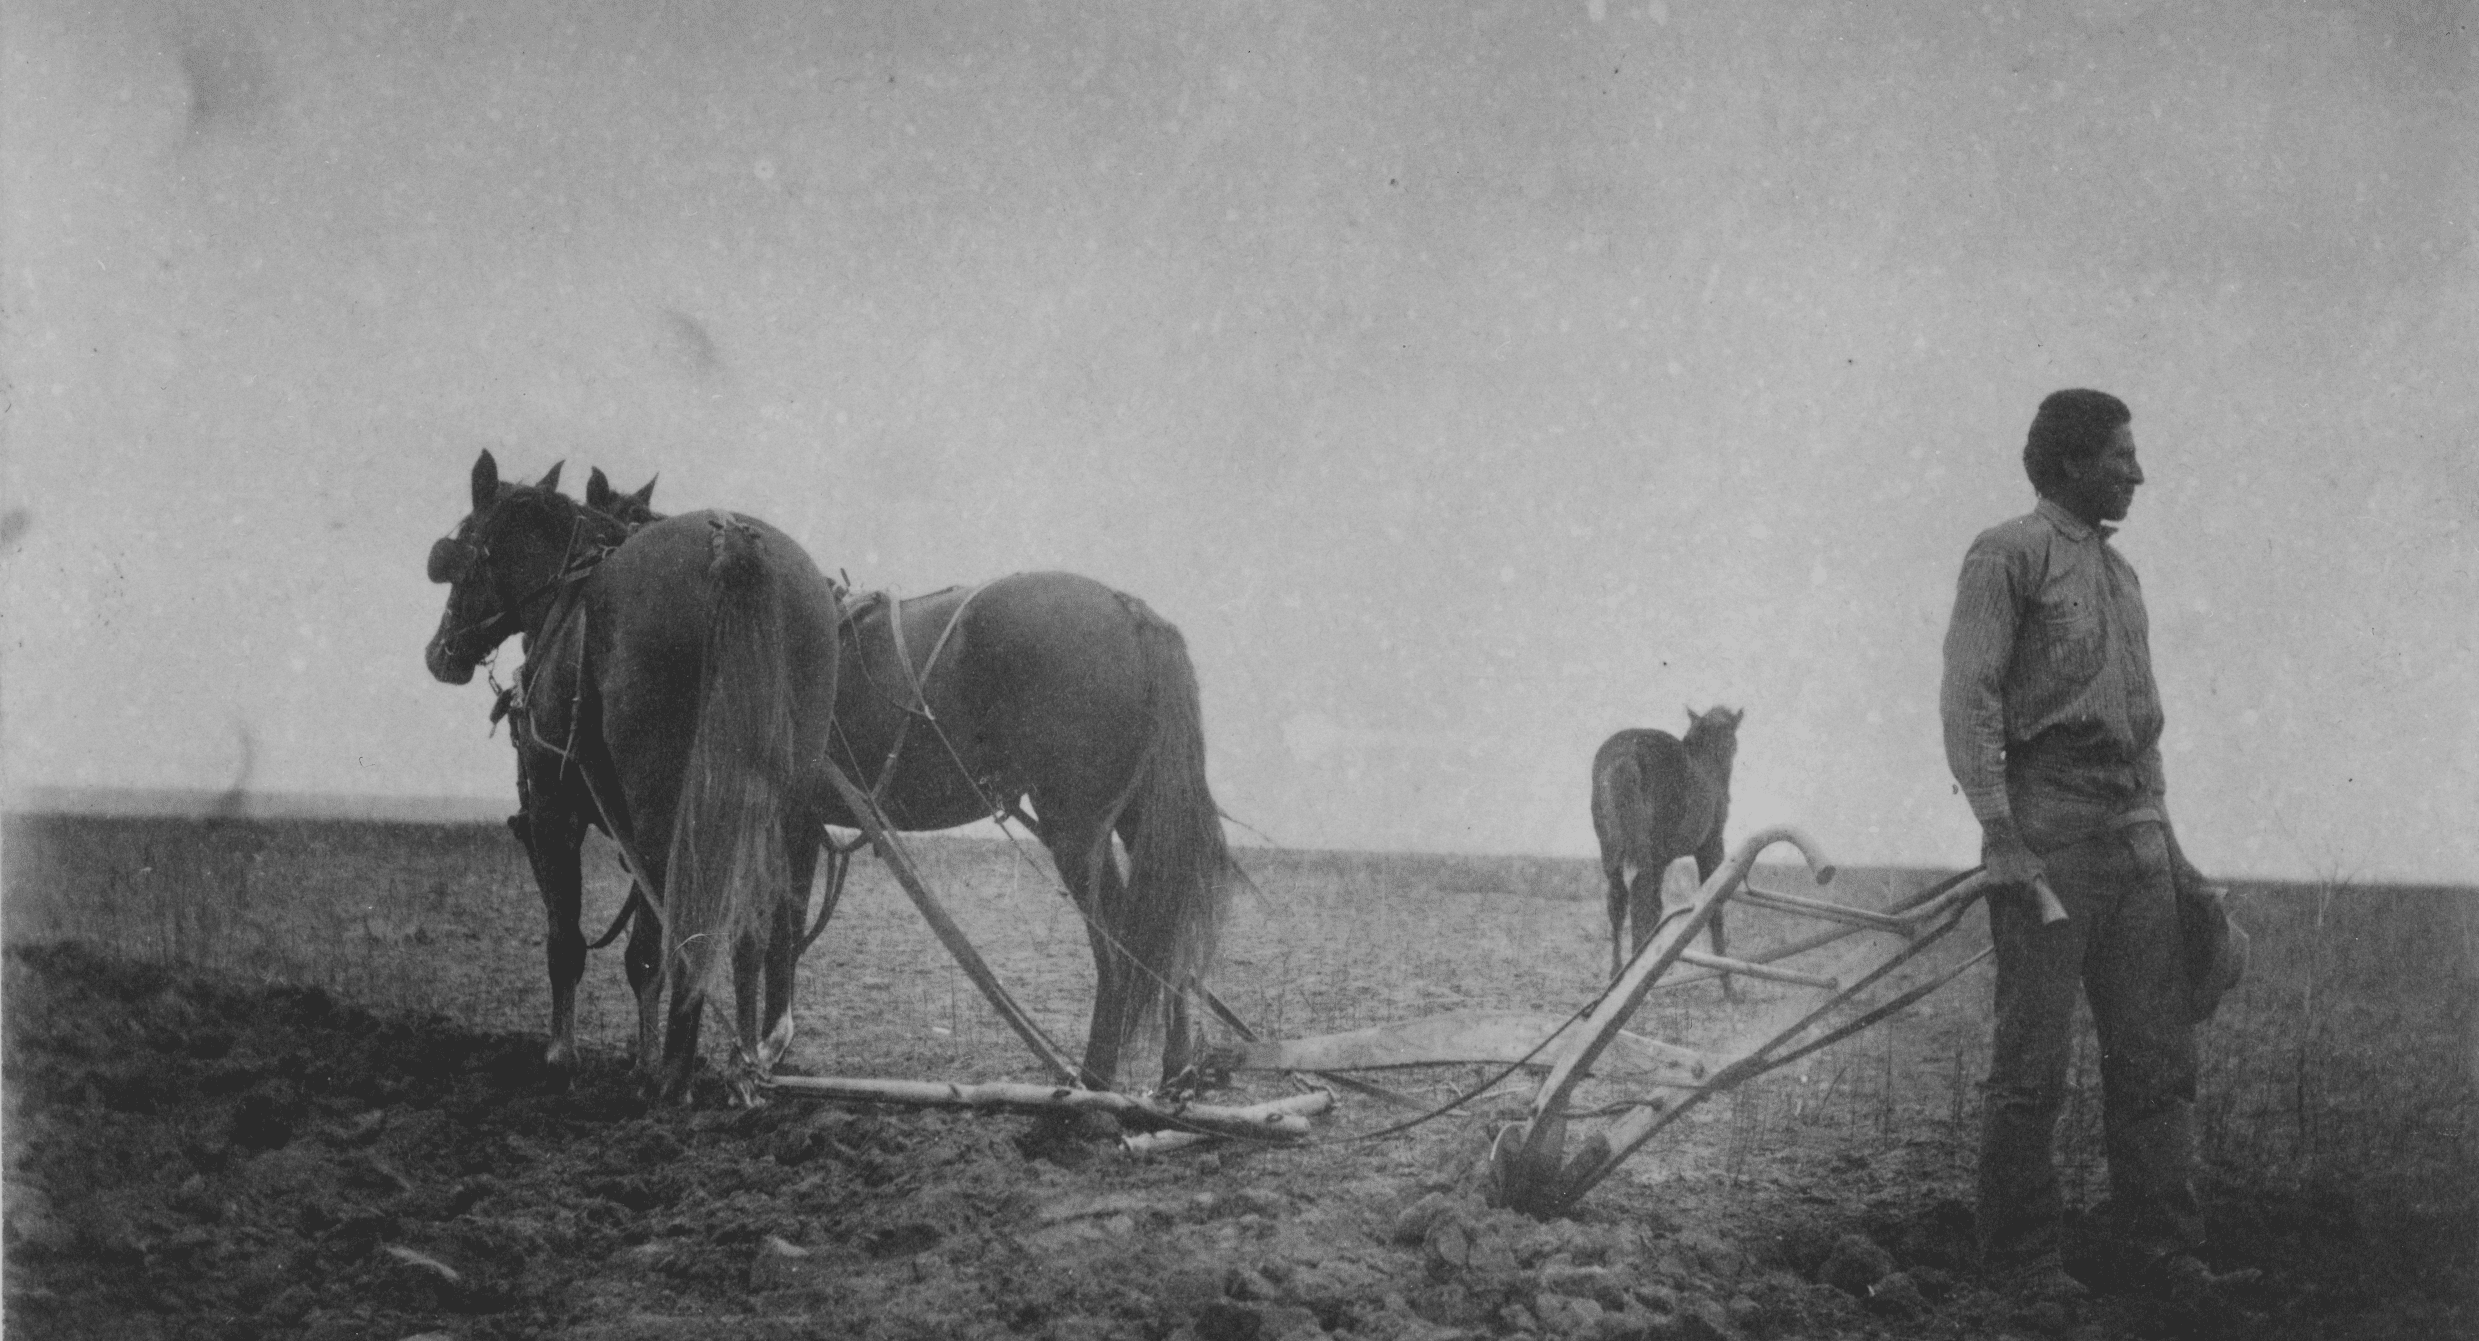
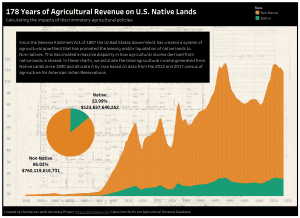
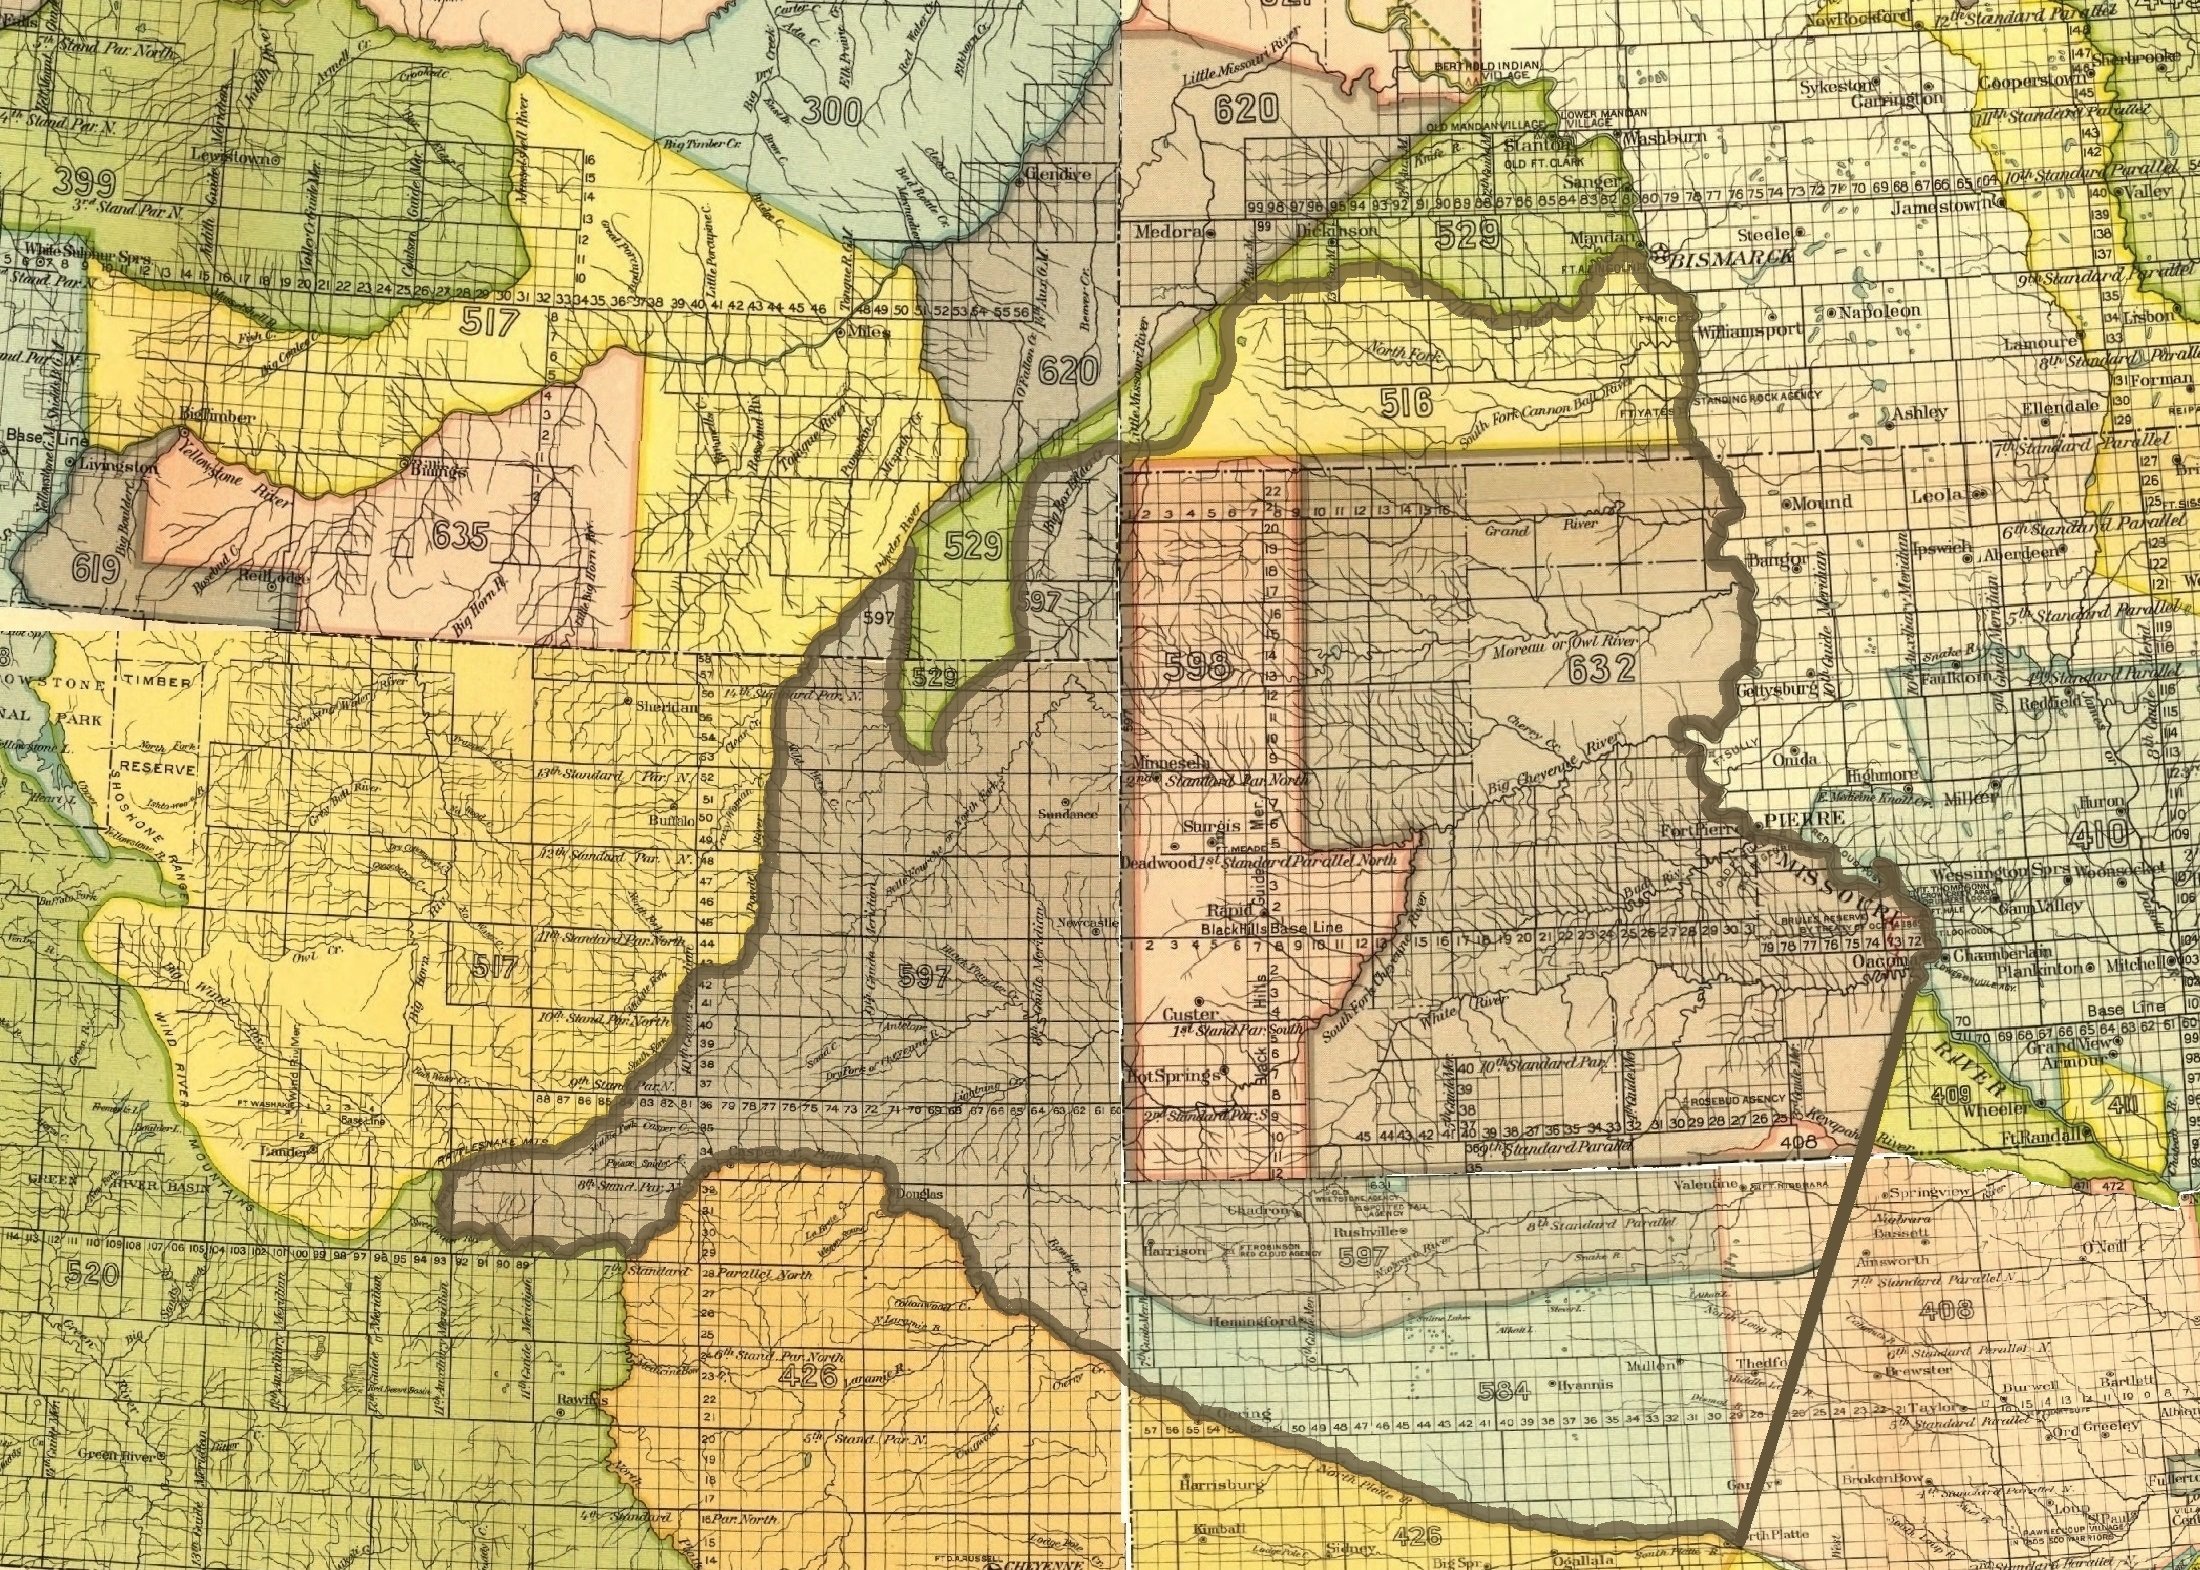
The General Allotment Act of 1887 Crippled Native Agriculture for Generations
Today, the US Bureau of Indian Affairs (BIA) holds 66 million acres of lands in trust for various Indian tribes and individuals. Approximately 46 million acres
Introducing the Native Land Information System
The Native Land Information System serves as a repository of learning resources, information, and data to help defend and protect Native lands for the benefit of Native peoples.