By Raven McMullin // April 18, 2022
NLAP remains committed to making available to Tribes, Native organizations, and land caretakers the most relevant and current data critical for Native land planning and research. In furtherance of this commitment, we are excited to announce new updates to our National Land Cover Database Dashboard (NLCD) along with a newly built companion thematic map!
As you may know, our NLCD Dashboard provides nationwide data on land cover and land cover change, and was developed by the Multi-Resolution Land Characteristics (MRLC) consortium, a group of federal agencies who coordinate and generate consistent and relevant land cover information at the national scale for a wide variety of environmental, land management, and modeling applications. The NLCD Dashboard amazingly has a widespread application in biology, climate, education, land management, hydrology, environmental planning, risk and disease analysis, telecommunications, and visualization.
What’s New in the NLCD Dashboard:
- Our original dashboard launched in 2020 included NLCD data for 2001 and 2016, the most current data and the time of publication. The new dashboard now integrates ALL NLCD years leading up to 2019! This makes our dashboard more powerful in comparing data trends over time.
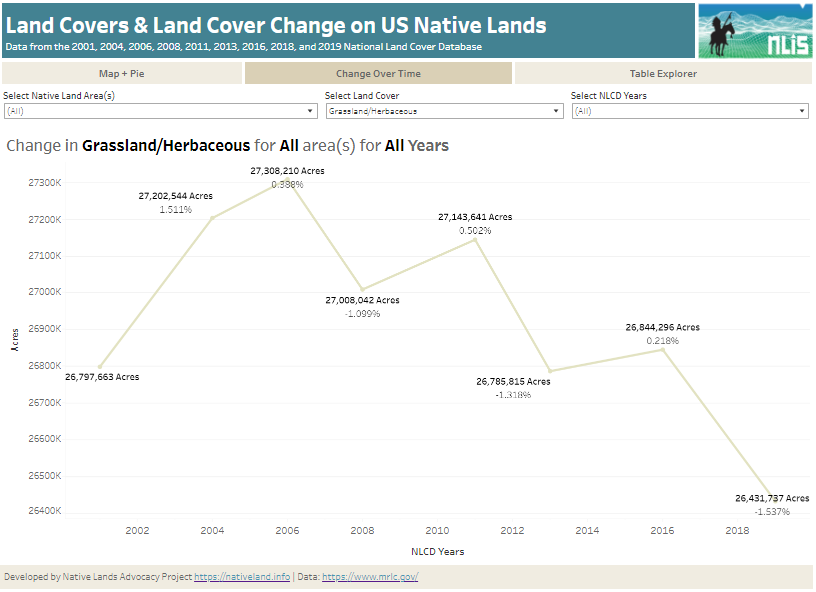
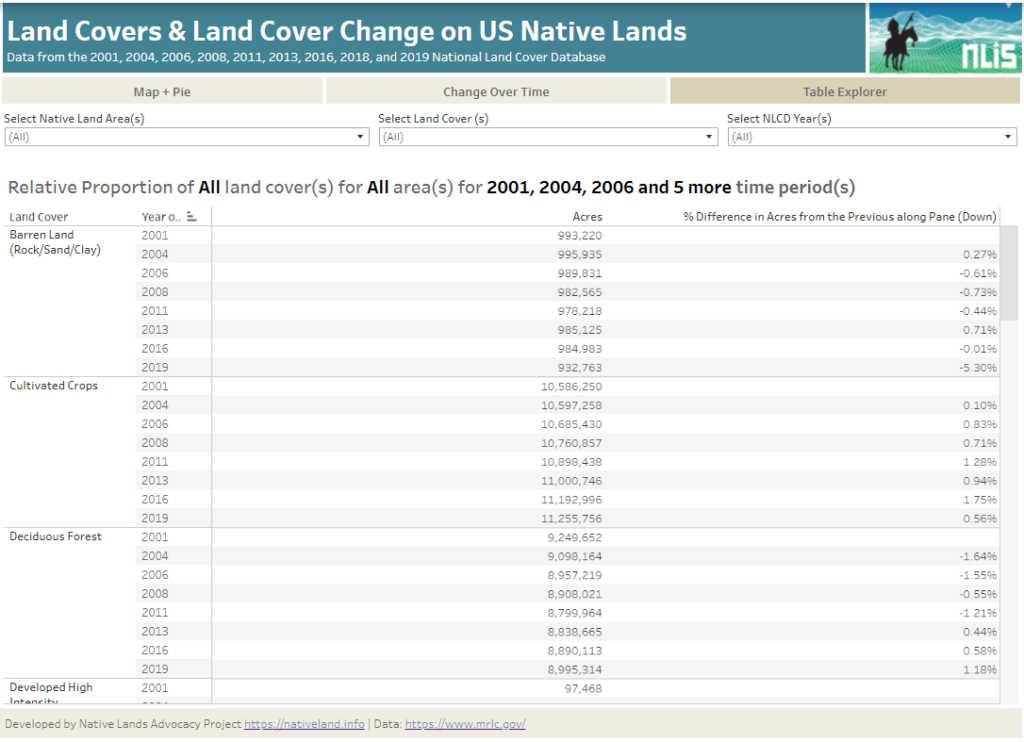
- Updated “Change Over Time” chart and “Table Explorer” that summarizes annual Land Cover data for any type of Land Cover vegetation you are interested in (or you can also view data for all types of Land Covers all at once)! Users may download these charts to include in their own research and presentations!
- Companion Thematic Map of National Land Cover on Tribal Lands. All of our dashboards will now have a related thematic map to compliment the data compiled into our dashboards. Scroll further down to read more about our new Tribal Lands Viewer map!
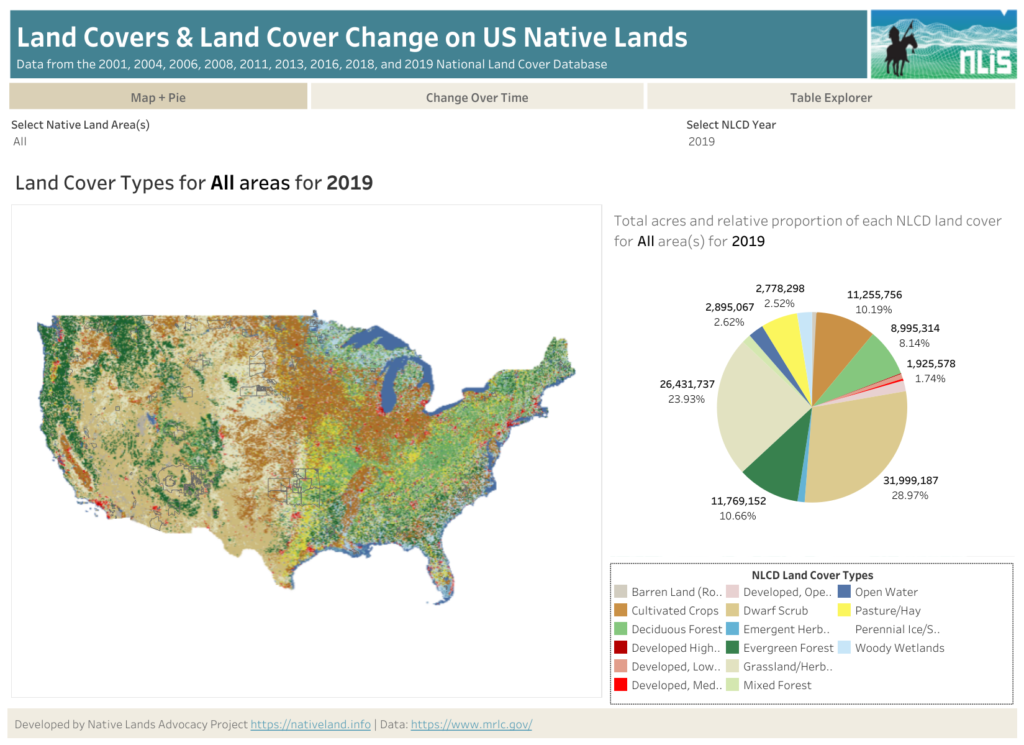
Analyze Changes over Time:
Users can also choose to view the data in our “Change Over Time” line chart view, or our “Table Summary” view as well as select which Native land area, land cover type, and NLCD year they wish to analyze. Below are screenshot examples and a video demonstrating how to upload screenshots into PowerPoint!
How to Download our Dashboard Analytics and Upload to PowerPoint
Uses of the NLCD for Tribes, Native organizations, and Land Caretakers
The NLCD Dashboard can help answer questions relating to:
- What land covers are found on Native lands in the coterminous United States?
- How are these land covers changing over time?
- How do land covers on Native lands compare to non-native lands?
- What trends appears for urbanization, forest cover, harvested cropland, etc
For Native communities specifically, here are ways that Tribes could potentially use the data compiled in the NLCD in addition to their local knowledge and data :
- Access the land cover data needed for general land-use planning for a particular Native land area: forage for livestock, erosion control, recreational resources, climate planning, etc.
- Inform their development of an Agricultural Resource Management Plan or Integrated Resource Management Plan
- Identify areas of needed protection by analyzing land cover changes over time
- Estimate risks related to pollution and natural hazards
- Investigate potential trends in wildlife habitat and land health; examine relationships between wildlife and habitat
- Identify your area of interest and easily download and import data charts into your own presentations and research!
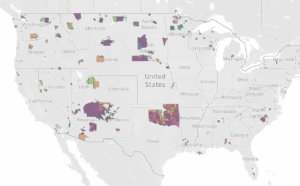
NLCD Companion-Thematic Map: Tribal Lands Viewer
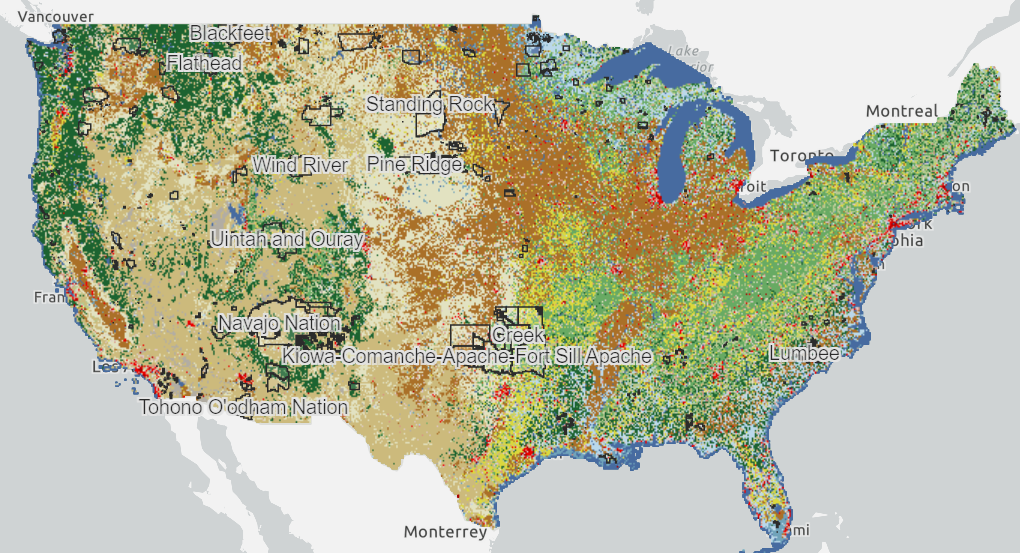
This thematic map created for the NLCD Dashboard uniquely allows users to view land covers on Tribal lands! Some key features of this map:
- Filter map view by Native reservation; allows for zoom-in or zoom-out of a particular Native land area
- Annotate: Tribes may draw points, lines, or polygons on the map to highlight a specific area of interest
- View a legend for the land cover types and types of change for a particular Native Land area
- Generate a specific view of the map to export as PDF and add into reports, presentations, etc
Try out both our updated dashboard and thematic map today, and let us know how it might benefit your relations!

