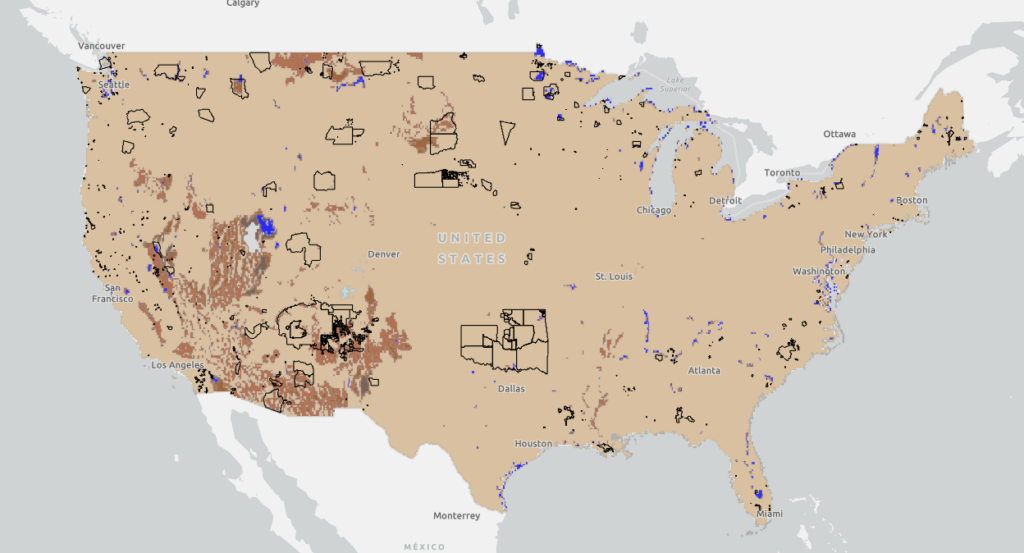
Available Water in Soil on US Native Lands
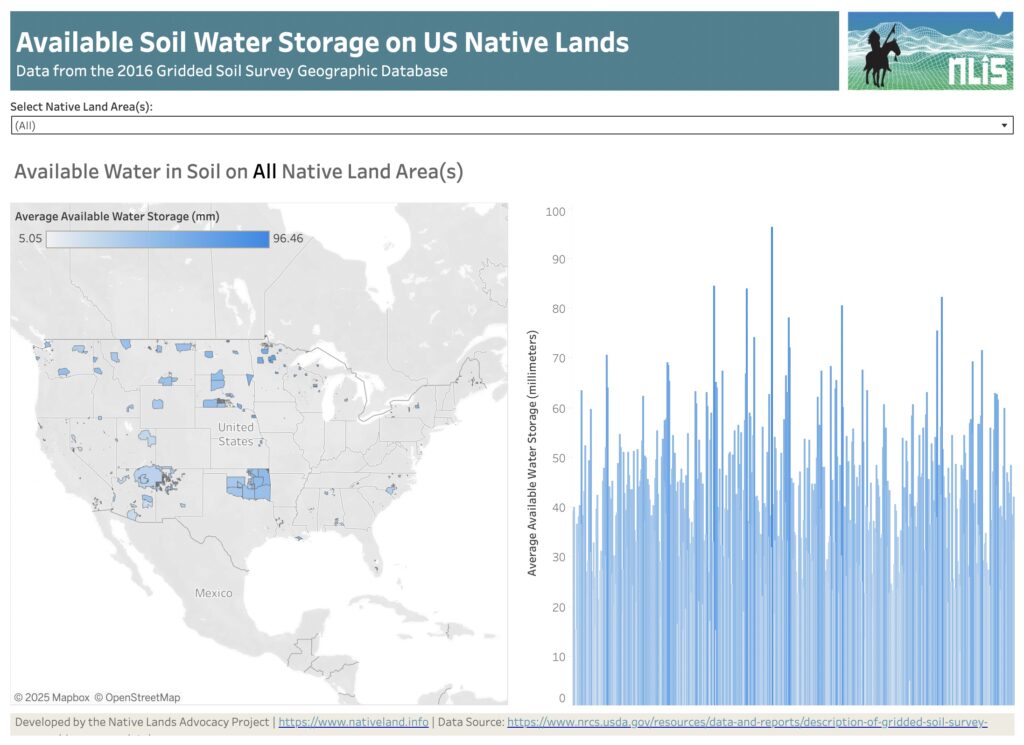
About this Dashboard This dashboard features a reservation-level view of the available water data in soil on all tribal lands in the US. Data comes from the USGS Gridded soil survey for 2016. The “available water in soil” variable from gridded soil surveys refers to the quantity of water that a soil can store and […]
We Remain Committed to Empowering Tribal Self-Determination & Data Sovereignty

The Native Lands Advocacy Project (NLAP) was founded in 2019 to provide much-needed data support to Native American communities. As a project of the nonprofit Village Earth, NLAP is inspired and guided by 30+ years of grassroots work in direct support of communities’ needs. Since NLAP’s inception, our work has been guided by the needs […]
Keystone Data Tools for Native Land Planning: View the webinar recordings & share your feedback
This month, the Native Lands Advocacy Project (NLAP) wrapped up our webinar series: Keystone Data Tools for Native Land Planning. These webinars introduced attendees to three foundational datasets that Native Nations & citizens can use to make informed, sovereign decisions for their futures: The USDA Census of Agriculture for American Indian Reservations The National Land […]
Introducing the Climate Data Portal for U.S. Native Lands

The Native Lands Advocacy Project (NLAP) is thrilled to announce the launch of our Climate Data Portal for U.S. Native Lands! Developed with funding from the Native American Agriculture Fund, this portal is the result of our dedicated GIS team’s efforts to create & consolidate relevant climate-related data tools into one living resource. NLAP acknowledges […]
Average Wind Speed on US Native Lands
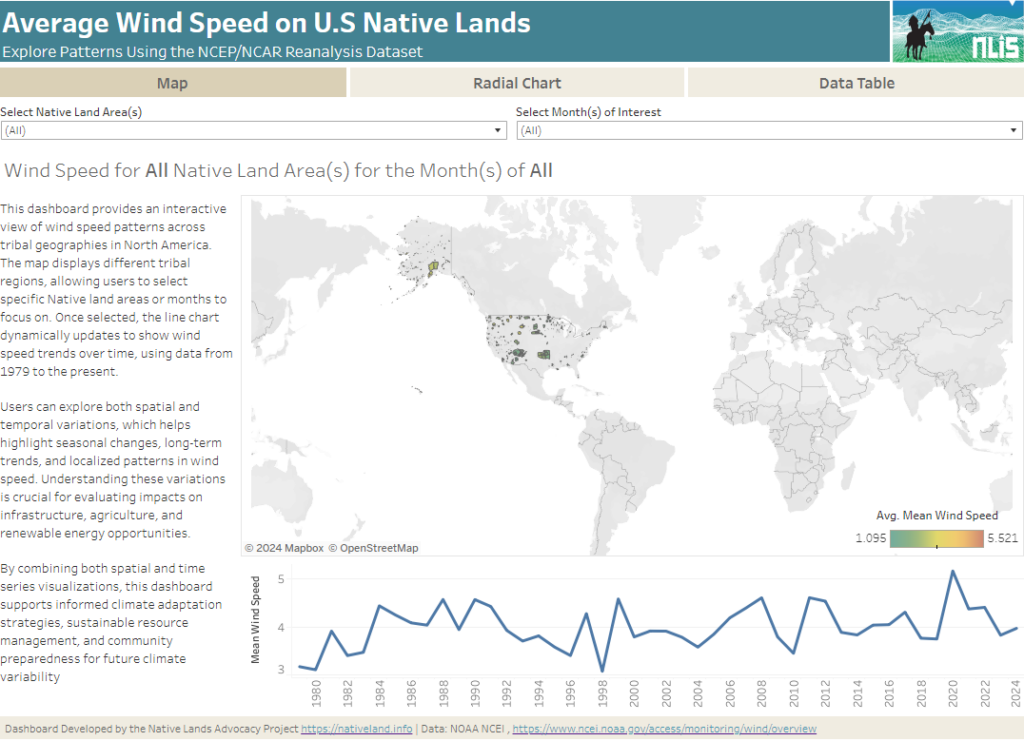
About this Dashboard This interactive dashboard provides a comprehensive analysis of average wind speed patterns across tribal lands in North America, using data from the NCEP/NCAR Reanalysis dataset. The dashboard allows users to explore wind speed trends by selecting specific Native land areas and years, or by viewing aggregated data across all regions and years. […]
Introducing Our New Storymap: Good Fire: Mitigating Wildfire Risk & Healing Native Lands
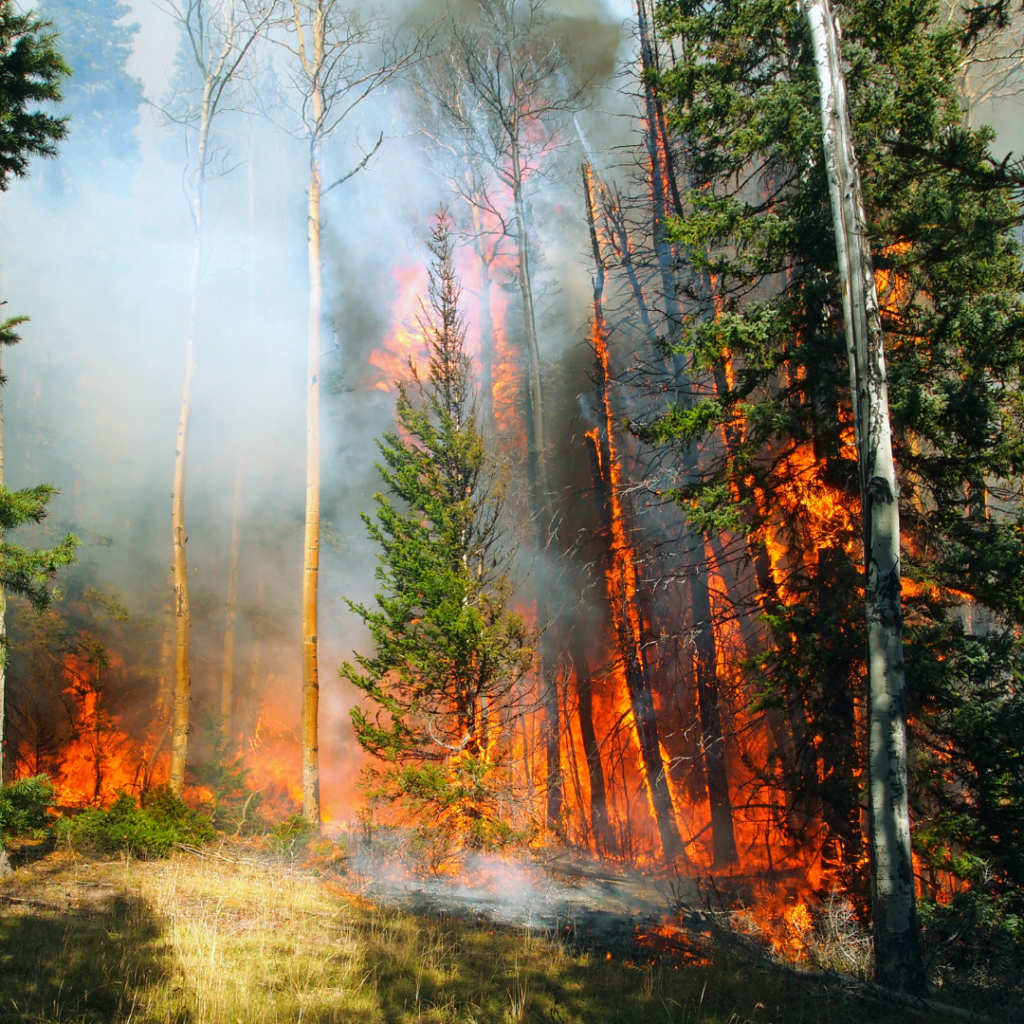
The Native Lands Advocacy Project is happy to announce our newest storymap: Good Fire: Mitigating Wildfire Risk & Healing Native Lands!
New Data Tools for Fire Stewardship on Native Lands
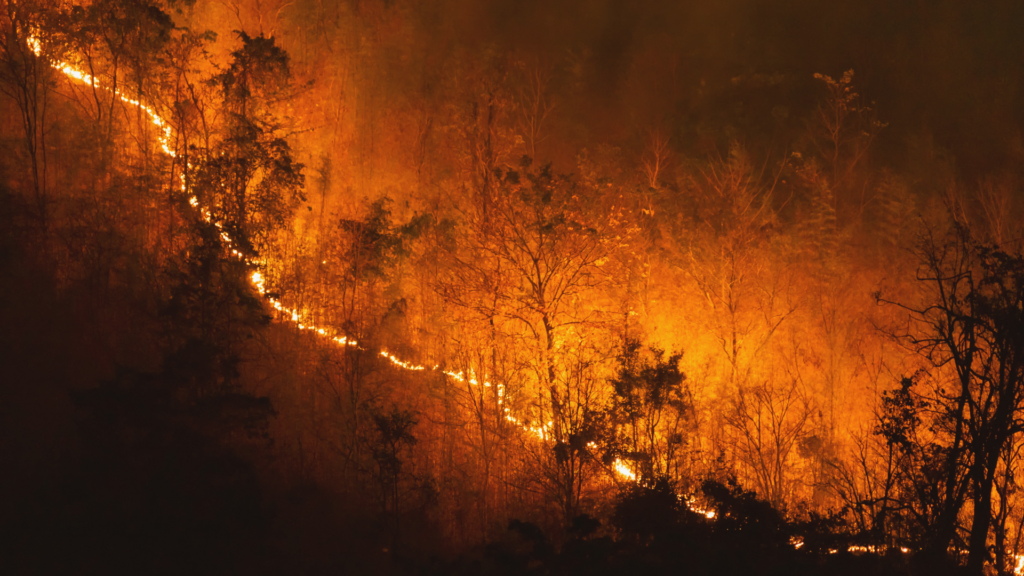
The Native Lands Advocacy Project (NLAP) is excited to highlight three data tools related to fire on U.S. Native lands. These three tools (our Thermal Activity Map, Environmental Risks Dashboard, and Extent of Fires on US Native Lands Dashboard) can help users understand the factors contributing to wildfires and their impact on Native Nations. These […]
Precipitation Projections and Winter Trends on US Native Lands
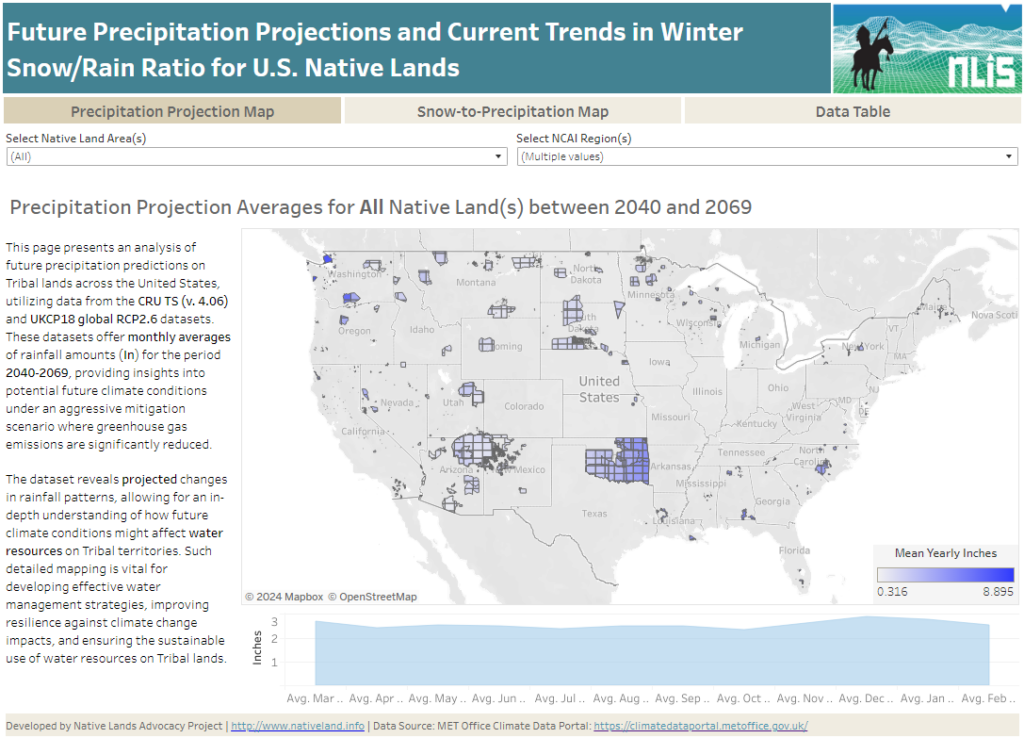
About this Dashboard This data dashboard summarizes data from future precipitation predictions and historical changes in the snow-to-precipitation ratio on Tribal lands in the contiguous United States. The precipitation predictions are based on datasets from the CRU TS (v. 4.06) and UKCP18 global RCP2.6 scenarios, while the snow-to-precipitation ratio data comes from 177 weather stations […]
Soil Salinity in U.S. Native Lands
This map displays soil salinity data layers derived from the Harmonized World Soil Database (HWSD) Global Soil Quality – Constraints due to Excess Salts (HWSD Excess Salts). This Soil Salinity data on US Native Lands is presented here as a potential resource for Tribes to use in natural resource and climate adaptation assessment and planning.
Change in Rain & Snow Patterns on U.S. Native Lands
This map displays data layers based on the EPA’s Climate Change Indicators in the United States report, specifically focusing on Change in Rain & Snow Patterns on U.S. Native lands. On this map, view layers related to change in snowfall, precipitation, snow-to-precipitation ratio, and April snowpack in western US.
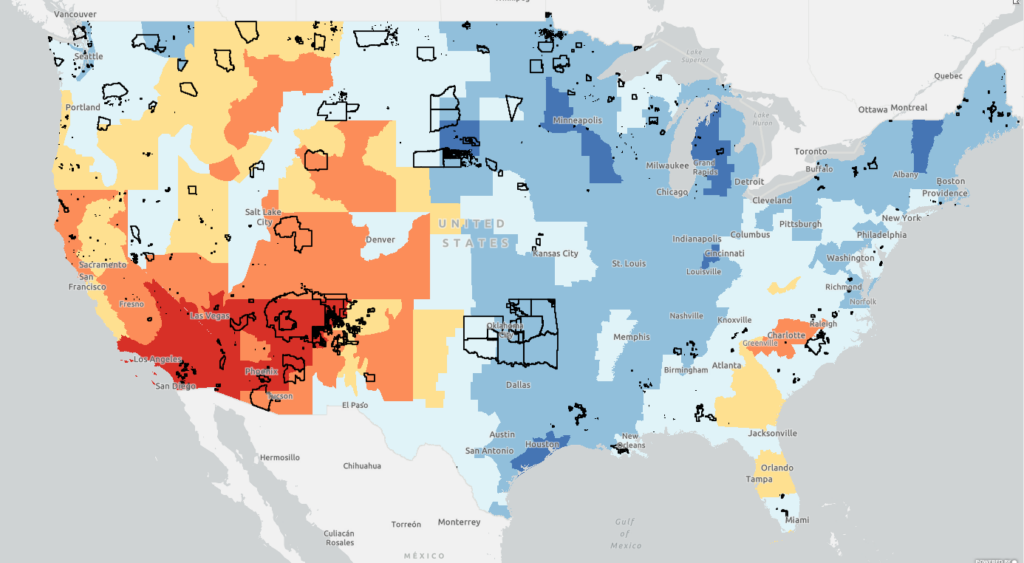
Temperature Change Patterns on U.S. Native Lands
This map displays data layers based on the EPA’s Climate Change Indicators in the United States report, specifically focusing on Temperature Change Patterns on U.S. Native lands. On this map, view layers related to annual average air temperatures, unusually hot temperatures, and unusually low temperatures.
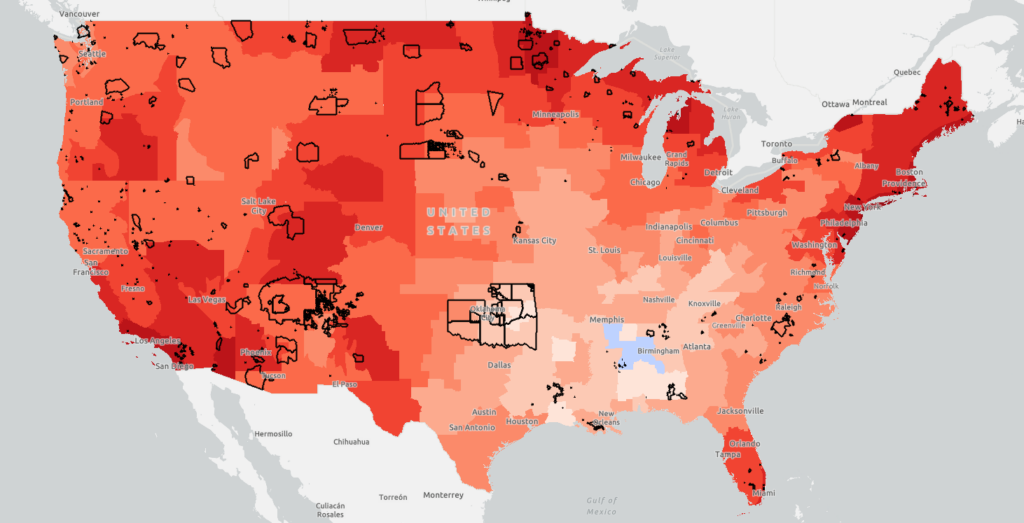
Extent of Fires on US Native Lands
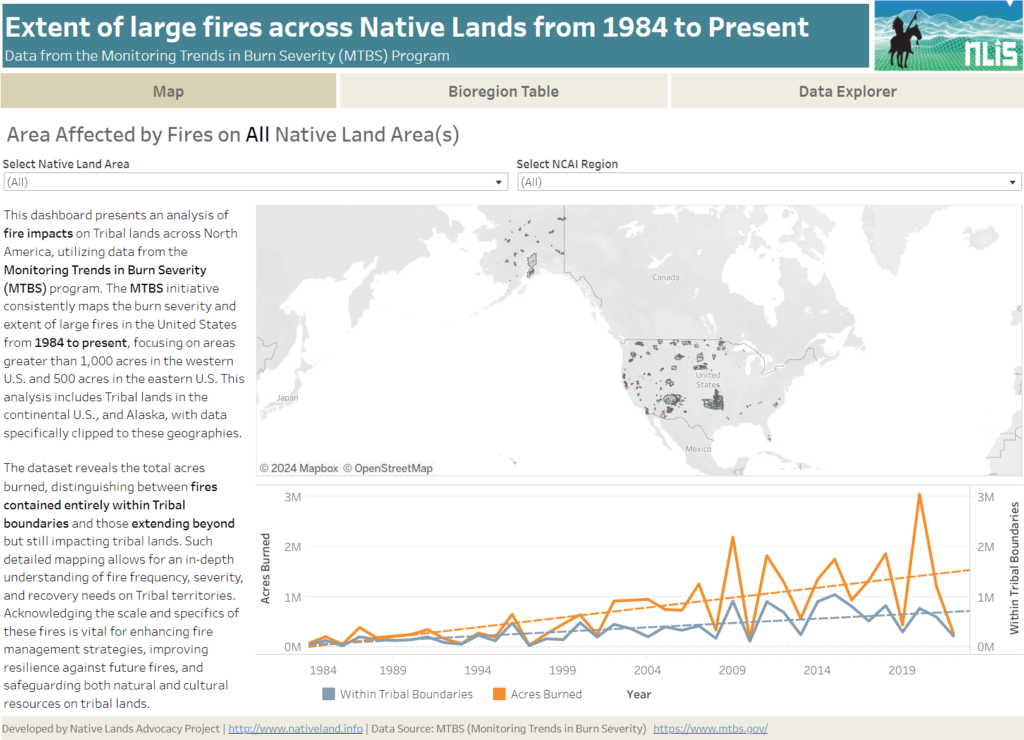
About this Dashboard This data dashboard summarizes data from the Monitoring Trends in Burn Severity (MTBS) Dataset, which the USGS EROS and the United States Department of Agriculture Forest Service jointly implemented. It highlights the distribution and impact of wildfires on Native lands between 1984 and 2022. The dashboard features detailed maps and interactive elements, allowing users […]