About the Data
This map displays data layers based on the EPA’s Climate Change Indicators in the United States report, specifically focusing on Change in Rain & Snow Patterns on U.S. Native lands. The purpose of these data layers is to provide evidence of climate change observations and their impact on Native lands.
Each indicator in the Climate Change Indicator report represents the state or trend of certain environmental or societal conditions over a given area and a specified period of time. These indicators are accessible through the EPA, which partners with dozens of data contributors to compile and maintain them. EPA partners with over 40 data contributors from various government agencies, academic institutions, and other organizations to compile and communicate key indicators related to the causes and effects of climate change. The indicators consist of peer-reviewed, publicly-available data from a number of government agencies, academic institutions, and other organizations. In addition to being published by the EPA, these datasets have also been published in the scientific literature and in government or academic reports. Details on each dataset can be reviewed here.
The geospatial layers used in this thematic map are hosted by the EPA and other contributors on ArcGIS Online. These layers are accessible for export and download with an active ArcGIS Online License. Keep an eye out for more Climate Change Indicator data tools on the NLIS & join our mailing list below!
Indicators in this Map: Change in Rain & Snow Patterns On U.S. Native Lands
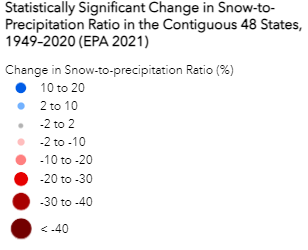
Change in Snow-to-Precipitation Ratio in the Contiguous 48 States, 1949–2020 (EPA 2021)
These data show trends in the proportion of total winter precipitation that falls as snow, known as the “snow-to-precipitation” ratio. This ratio is calculated by comparing the amount of snowfall to the total precipitation (snow plus rain) each year, with snowfall converted to its liquid water equivalent. The data were collected from hundreds of weather stations across the contiguous 48 states and cover the period from 1949 to 2020. A decrease (red circle) in the ratio indicates more precipitation is falling as rain rather than snow. Solid-color circles represent stations with statistically significant trends. This data layer is based on an analysis by Feng and Hu (2007) using data from the Global Historical Climatology Network, tracked by the National Centers for Environmental Information and available online at www.ncei.noaa.gov.
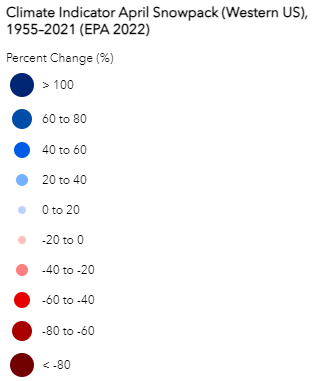
Climate Indicator April Snowpack (Western US), 1955–2021 (EPA 2022)
These data show trends in April snowpack in the western United States, measured as snow water equivalent, which is the amount of water contained within the snowpack at a specific location. This measure indicates the depth of water that would result if the entire snowpack melted. The data layer shows long-term rates of change for April 1, the most frequently observed date, as it can reflect changes in precipitation and is extensively used for spring streamflow and water supply forecasting. Blue circles represent increased snowpack; red circles represent a decrease.
The EPA selected 1955 as the starting point for this data layer because many measurement sites in the Southwest were established in the early 1950s. The underlying data for this indicator come from the U.S. Department of Agriculture’s Natural Resources Conservation Service Water and Climate Center.
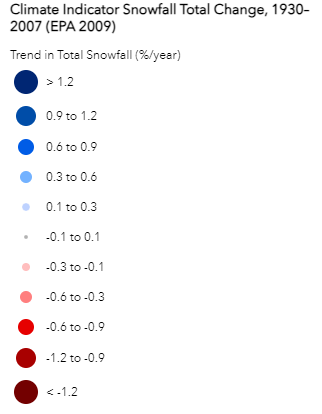
Climate Indicator Snowfall Total Change, 1930–2007 (EPA 2009)
These data show the average rate of change in total snowfall from 1930 to 2007 at 419 weather stations in the contiguous 48 states. Blue circles represent increased snowfall; red circles represent a decrease.
Total snowfall is measured by the height of snow that accumulates each day. The selected stations had high-quality data for the entire period. This indicator is based on an analysis of snowfall from October to May, which accounts for most snowfall in most locations. However, it might not represent the entire snow season in some areas. Data for mountainous regions mainly come from lower elevations (towns in valleys) because that is where weather stations are typically located. The EPA is working on identifying an appropriate method of analysis for updating this indicator. This data layer is adapted from an analysis by Kunkel et al. (2009) based on records from Cooperative Observer Program weather stations.
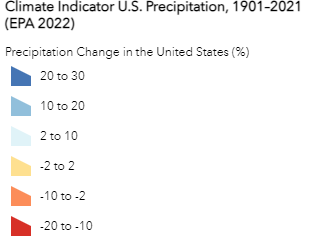
Climate Indicator U.S. Precipitation, 1901–2021 (EPA 2022)
These data show the rate of change in total annual precipitation in different parts of the United States since the early 20th century (since 1901 for the contiguous 48 states and 1925 for Alaska). This indicator examines U.S. and global precipitation patterns based on rainfall and snowfall measurements from land-based weather stations worldwide. The data are presented for climate divisions, as defined by the National Oceanic and Atmospheric Administration (NOAA). The underlying data for this indicator are provided by NOAA’s National Centers for Environmental Information, which maintains a large collection of climate data online at www.ncei.noaa.gov.