FSTI Top 10 Native Lands

This dashboard showcases the top 10 ranking Native Lands of the Food-System Transition Index 2020. This snapshot gives us insights into the social-demographic, economic and geographic characteristics of each top 10 territory to try to identify patterns that might explain their high ranking.

About the Top 10 Dashboard

We created this dashboard 1) to show the top 10 highest ranking lands of the FSTI 2020 and 2) to explore their profiles and characteristics, and observe possible explanations for their high score. Evidently, the sample is too small to make any kind of statistically significant inferences, but it is a first step towards identifying possible trends. We collected additional social-demographic, historical, economic and geographic data for these top ranking lands to complete their FSTI characteristics. It was striking to realize that these territories vary greatly across all variables, which raises very important questions for native food systems and food policy-making on US native land. These figures show that the commonly held assumptions about the effects of market economy, population density and geography on food-systems are greatly insufficient to explain why these territories seem to have stronger food-systems on US native land. Yet, many food policies are based on such measures. In sum, more research is critically needed to better identify what most impacts food systems and best inform tribal decision-making.

Explore the Top 10 Native Lands

If you have not yet explored the Food-System Transition Index 2020 for US Native Land

Top 10 profiles

1- Turtle Mountain

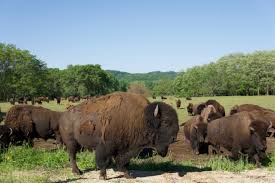
Mikinaakwajiw-ininiwag

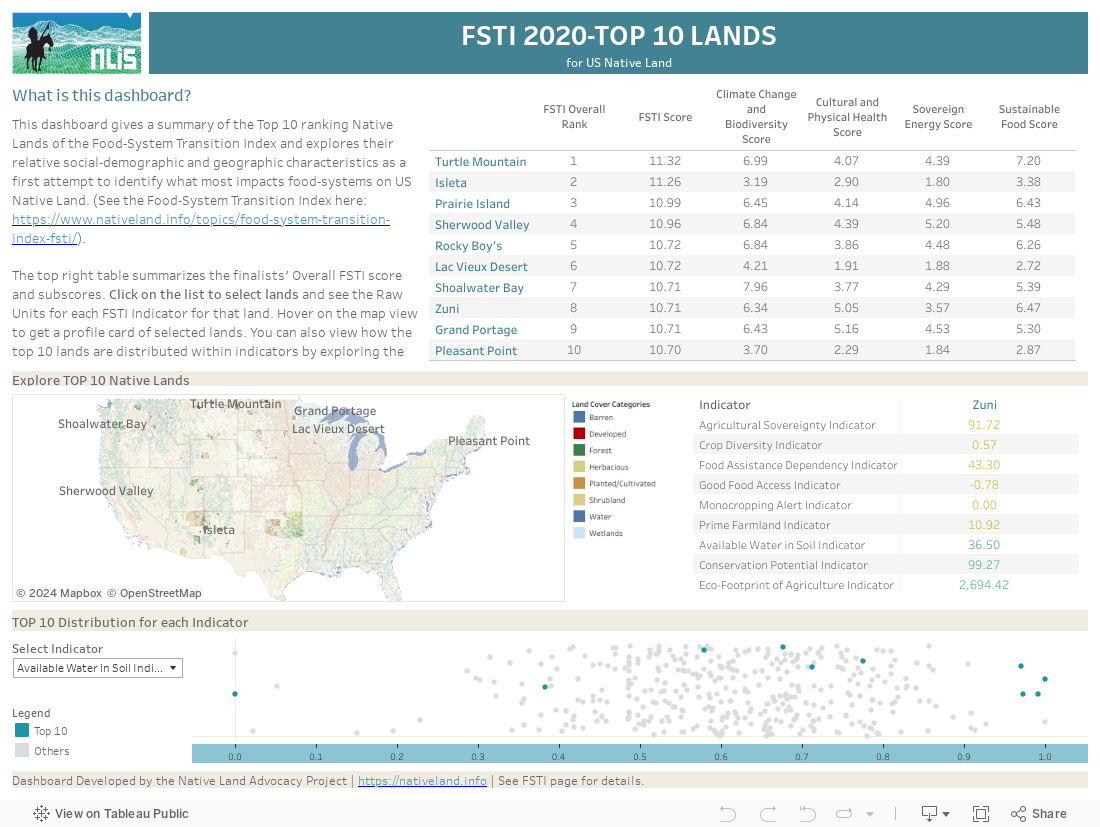
This land ranked 1 in the NFSI 2020. The people's language is Anishinaabemowin. This territory was ruled as a federally-recognized tribe in 1858 by the Sweet Corn Treaty. It counts 9232 inhabitants and a density of 40.59 people per square mile on a total land area of 227.42 square miles. The dominant geography on Turtle Mountain is Forest. Traditionally, the people relied mostly on Hunting-Gathering for food. Today, the mean yearly household income is $47,931 with an employment rate of 9%.
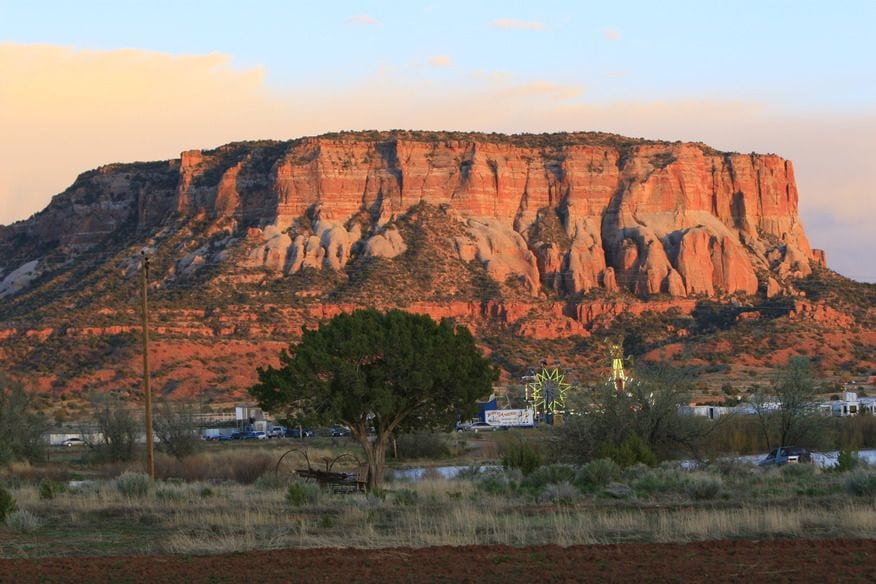
2-Isleta

Shiewhibak

This land ranked 2 in the NFSI 2020. The people's language is Tiwa. This territory was ruled as a federally-recognized tribe in 1924 by the Pueblo Land Acts. It counts 3730 inhabitants and a density of 11.30 people per square mile on a total land area of 330.13 square miles. The dominant geography on Isleta is Shrubland. Traditionally, the people relied mostly on Irrigated Agriculture for food. Today, the mean yearly household income is $44,325 with an employment rate of 14.9%.
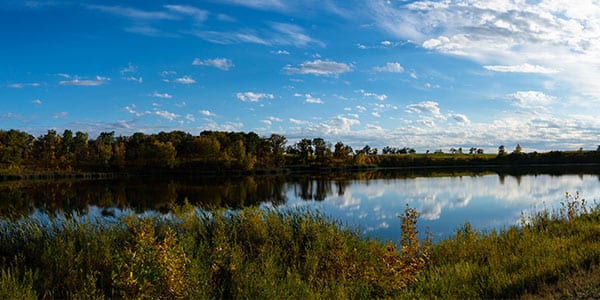
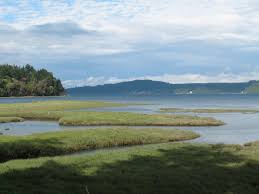
3-Prairie Island

Tinta Winta

This land ranked 3 in the NFSI 2020. The people's language is Dakota. This territory was ruled as a federally-recognized tribe in 1851 by the Treaty of Traverse des Sioux. It counts 186 inhabitants and a density of 46.44 people per square mile on a total land area of 4.01 square miles. The dominant geography on Prairie Island is Wetlands. Traditionally, the people relied mostly on Hunting-Gathering for food. Today, the mean yearly household income is $100,183 with an employment rate of 9.1%.
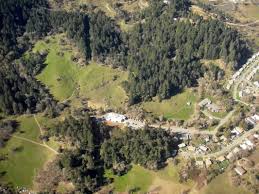
4-Sherwood Valley

Kulá Kai Pomo

This land ranked 4 in the NFSI 2020. The people's language is Pomo. This territory was ruled as a federally-recognized tribe in 1934 by the Indian Reorganization Act. It counts 164 inhabitants and a density of 211.98 people per square mile on a total land area of 0.77 square miles. The dominant geography on Sherwood Valley is Shrubland. Traditionally, the people relied mostly on Hunting-Gathering for food. Today, the mean yearly household income is $37,053 with an employment rate of 31.6%.
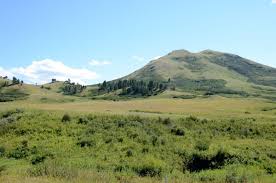
5-Rocky Boy's

Ahsiniiwin

This land ranked 5 in the NFSI 2020. The people's language is Chippewa-Cree. This territory was ruled as a federally-recognized tribe in 1916 by Congressional Statute. It counts 3794 inhabitants and a density of 22.16 people per square mile on a total land area of 171.19 square miles. The dominant geography on Rocky Boy's is Shrubland. Traditionally, the people relied mostly on Hunting-Gathering for food. Today, the mean yearly household income is $42,383 with an employment rate of 13.4%.

6-Lac Vieux Desert

Gete-gitigaaniwininiwag

This land ranked 6 in the NFSI 2020. The people's language is Anishinaabemowin. This territory was ruled as a federally-recognized tribe in 1854 by the Treaty of La Pointe. It counts 227 inhabitants and a density of 542.21 people per square mile on a total land area of 0.42 square miles. The dominant geography on Rocky Boy's is Developed. Traditionally, the people relied mostly on Hunting-Gathering for food. Today, the mean yearly household income is $31,685 with an employment rate of 1.8%.

7-Shoalwater Bay

Naaphs Chaahts

This land ranked 7 in the NFSI 2020. The people's language is Chinookan. This territory was ruled as a federally-recognized tribe in 1866 by a Presidential Executive Order. It counts 90 inhabitants and a density of 64.26 people per square mile on a total land area of 1.40 square miles. The dominant geography on Shoalwater Bay is Wetlands. Traditionally, the people relied mostly on Hunting-Gathering for food. Today, the mean yearly household income is $40,005 with an employment rate of 10.5%.
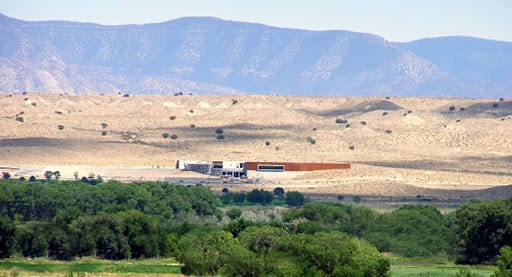
8-Zuni

Halona Idiwan’a

This land ranked 8 in the NFSI 2020. The people's language is A:shiwi. This territory was ruled as a federally-recognized tribe in 1877 by Presidential Executive Order. It counts 9505 inhabitants and a density of 13.12 people per square mile on a total land area of 724.59 square miles. The dominant geography on Zuni is Shrubland. Traditionally, the people relied mostly on Irrigated Agriculture for food. Today, the mean yearly household income is $41,842 with an employment rate of 20.7%.
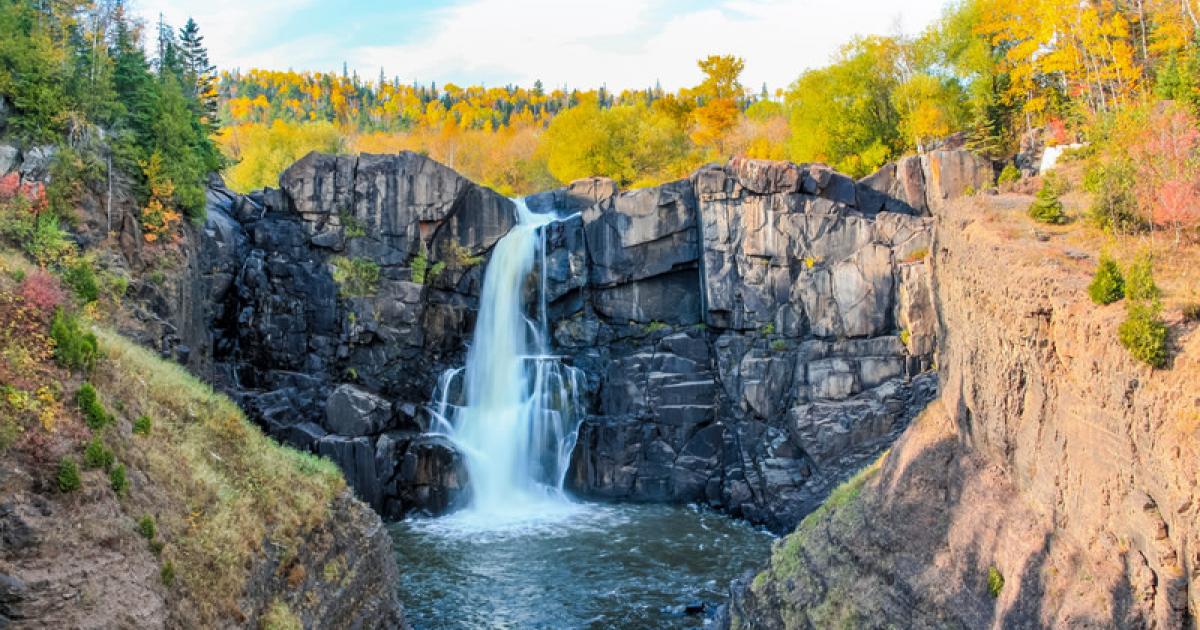
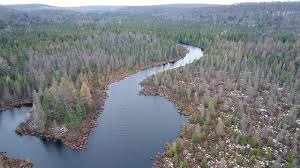
9-Grand Portage

Gichi-onigamiing

This land ranked 9 in the NFSI 2020. The people's language is Anishinaabemowin. This territory was ruled as a federally-recognized tribe in 1854 by the Treaty of La Pointe. It counts 718 inhabitants and a density of 9.63 people per square mile on a total land area of 74.53 square miles. The dominant geography on Grand Portage is Forest. Traditionally, the people relied mostly on Hunting-Gathering for food. Today, the mean yearly household income is $51,790 with an employment rate of 5.5%.
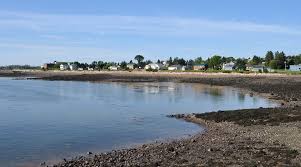
10-Pleasant Point

Sipayik

This land ranked 10 in the NFSI 2020. The people's language is Malecite-Passamaquoddy. This territory was ruled as a federally-recognized tribe in 1794 by the Jay Treaty. It counts 743 inhabitants and a density of 1315.98 people per square mile on a total land area of 0.56 square miles. The dominant geography on Pleasant Point is Developed. Traditionally, the people relied mostly on Hunting-Gathering for food. Today, the mean yearly household income is $41,417 with an employment rate of 21.5%.

About the Data

In order to build the profile for top 10 lands, we collected additional data from the tribes’ official websites and related online sources. The fields we collected include lands’ original native names, languages, and traditional modes of subsistence. They also include the names and years of the treaties that established the lands as federally-recognized. These years should not be mistaken for the length of times that these lands were occupied by particular tribes. In many cases, reservations were established on or near their ancestral homelands, which often overlapped with other tribes. In some cases such as for Isleta Pueblo or Zuni, the territories were actually sedentarily inhabited since the 14th century. In other cases, tribes were displaced far from their original homelands for political reasons and in direct violations of previous treaties.

The NLAP fully understand that these years and treaties do not reflect the history of land occupancy. However, they are a marker of two dialectical historical benchmarks: 1) the imprint of colonial expansion to build what is now the United States of America and 2) the documents that still establish to this day native sovereign rights to the land that they still have. This is why these benchmarks are useful to observe and understand native land use and the impact of land policies over time. 

Additionally, we also reported the major land cover category for each territory from our NLCD Land Cover dashboard, along with the population, land area and population density. Finally, we reported household mean income and unemployment rate from the Census ACS 2017-5YR. The rationale behind showing these variables was based on their usual influence in policy report and economic development initiatives. Even when it comes to food-systems, the mainstream classical economic idea that growth will inevitably leverage the field and create stronger food-systems remains dominant and impacts local policies and fundraising. However, the scientific relevance of these measures is widely questioned, as they only show the tip of the iceberg, and do not give much indications of community social wellbeing, education and health. But income measures are too often still taken as proxies to assess the impact of local planning, because the myth of income as being the absolute driver of positive community change is still so engrained worldwide as a byproduct of the developmentalist colonial narrative.

In native communities, we already know that high unemployment rates are mitigated by higher level of informal economy and barter. This does not mean that income does not play any part. In a monetary-based capitalist economy, consumption or the lack thereof does impact life chances and access to opportunities. But it cannot be used as a main proxy to assess the strength and resilience of local economies. Additionally, it does not give any indication of economic inputs/outputs flows and the level of economic self-sufficiency. Does a small reservation with a high-income due to a casino or lending enterprise necessarily build a stronger food-system? It might impact residents’ capacity to buy more and better food, but have virtually no impact on the capacity of the community to feed itself off sovereignly-managed land.

This pattern clearly shows among the top-10. The variance of income (and other variables) across all lands is suggesting that economic measures may not predict any successful outcomes for actual food sovereignty. These results are actually not surprising given the denseness of the FSTI. Here we have an Index which for the first time attempts to gather the complexity of resilient food-systems as advocated in the scientific literature: agricultural land control, the ecological footprint of agriculture, and soil organic carbon along with variables assessing languages, health and energy. 

The qualitative nuance of this Index is a real chance to question our assumptions about how to effectively build healthy and sovereign food-systems and use dedicated measures instead of proxies that continue to hurt communities’ efforts towards building stronger local economies with actual sustainable outcomes. What the top-10 ranking of the FSTI shows is that we need to modify general assumptions about what builds stronger food-systems and create the robust indicators that are truly needed to move towards climate-resilient sovereign economies that can feed local communities. What is needed is a bold shift in the way we conceive of and use data for planning.

You are free to use and share our dashboards. Here's how!

Do you have questions or comments about this data? Or do you have other data or charts you would like us to add to the site? let us by using the comments form below.