Temperature Change Patterns on U.S. Native Lands

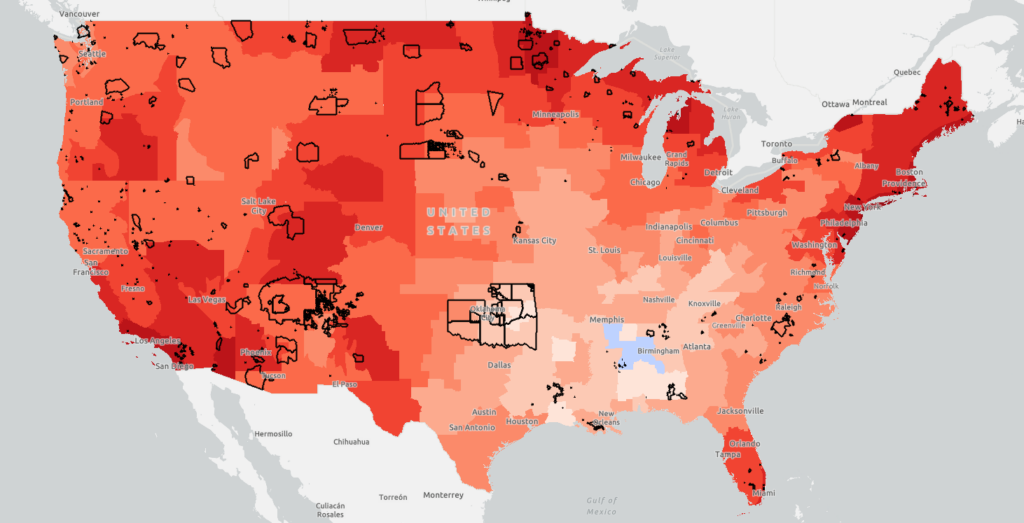
This map displays data layers based on the EPA’s Climate Change Indicators in the United States report, specifically focusing on Temperature Change Patterns on U.S. Native lands. On this map, view layers related to annual average air temperatures, unusually hot temperatures, and unusually low temperatures.

Good data is a cornerstone of Tribal Sovereignty.

When Native Nations have access to high-quality data, they can make informed decisions without relying on outside institutions or paywalled systems.

At the Native Lands Advocacy Project, we’re committed to ensuring that this data remains free, public, and Native-led.

And today, we’re asking for your support to keep it that way!