Energy & Mineral Revenue From US Native Lands (2008-2020)
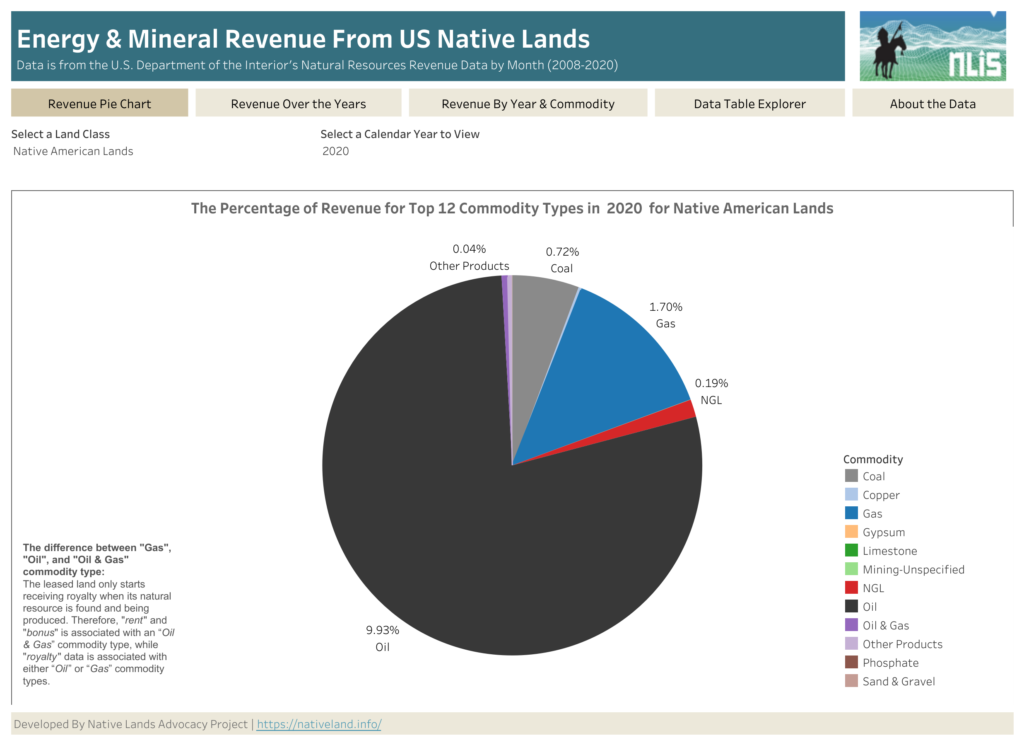
About this Dashboard This data dashboard, developed by the Native Lands Advocacy Project, summarizes data from the US Department of Interior’s Office of Natural Resources Revenue (ONRR) for US Native Lands for the period of 2008 through 2020. This dashboard also has the data for all federal lands. 0 Resource Types 0 Land Class 0 Years of […]
US Pipelines and Hazardous Liquid Spills 2010-2020
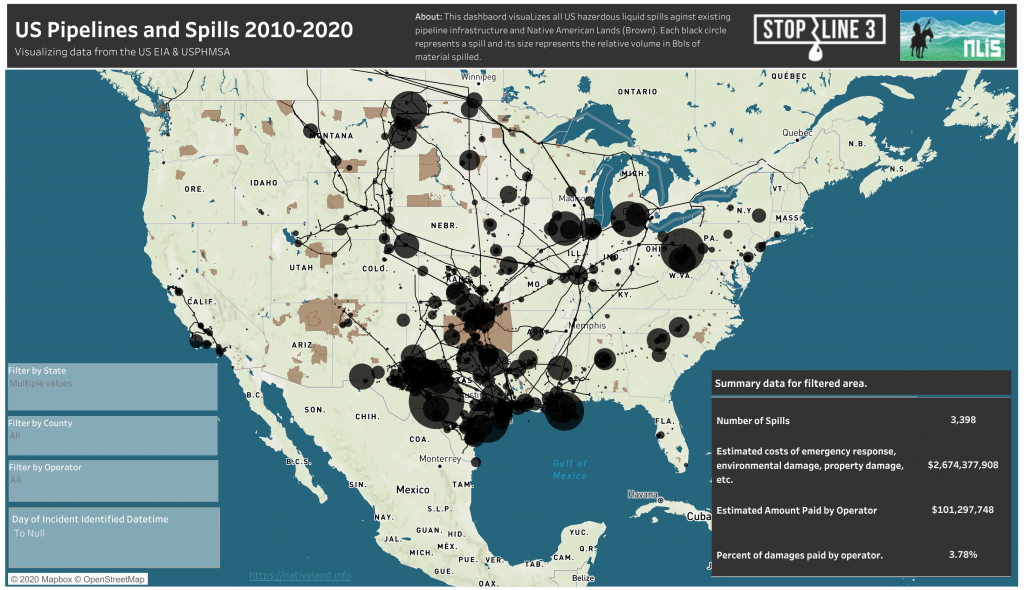
About this Dashboard This interactive data visualization developed by the Native Lands Advocacy Project visualizes all hazardous liquid spills in the United States from 2012-2020. It also includes maps of major pipelines and boundaries of contemporary Native lands. Spills are symbolized by black circles, and the size of the circle is relative to the volume […]