Keystone Data Tools for Native Land Planning: View the webinar recordings & share your feedback
This month, the Native Lands Advocacy Project (NLAP) wrapped up our webinar series: Keystone Data Tools for Native Land Planning. These webinars introduced attendees to three foundational datasets that Native Nations & citizens can use to make informed, sovereign decisions for their futures: The USDA Census of Agriculture for American Indian Reservations The National Land […]
Crop Diversity on US Native Lands
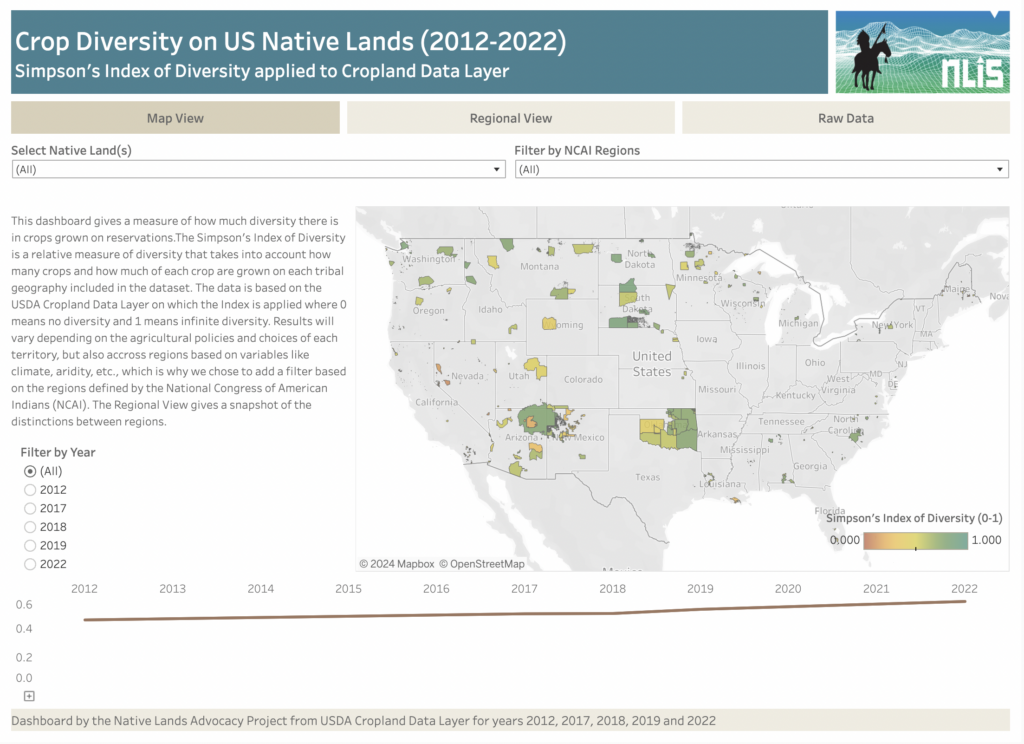
About this Dashboard The Crop Diversity Dashboard is an estimate of the relative diversity of crops grown on tribal lands. We use the Simpson’s Index of Diversity to estimate crop diversity from both the variety of crops grown and their respective acres within each reservation, with 0 meaning no crop diversity and 1 meaning infinite […]
Agricultural Water Stress on US Native Lands
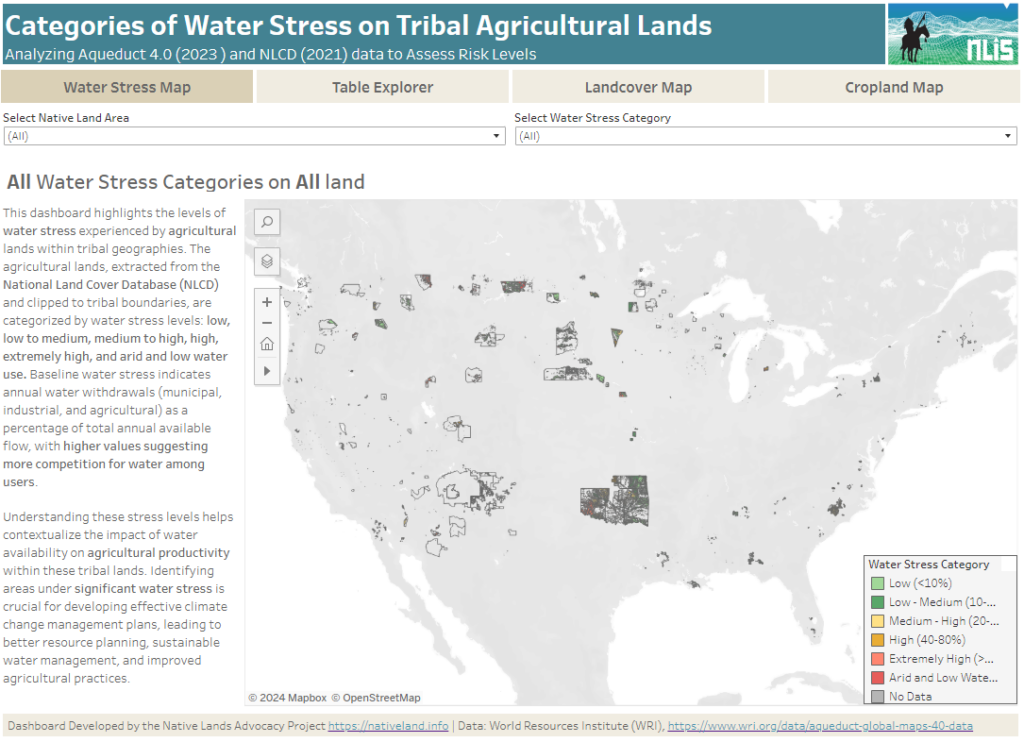
About this Dashboard This data dashboard summarizes data from the World Resources Institute, and the National Land Cover Database for Native Lands in the United States. It highlights the distribution and impact of water stress on agricultural lands within Native boundaries. The dashboard features detailed maps and interactive elements, allowing users to explore different water […]
National Land Cover Database: Tribal Lands Viewer
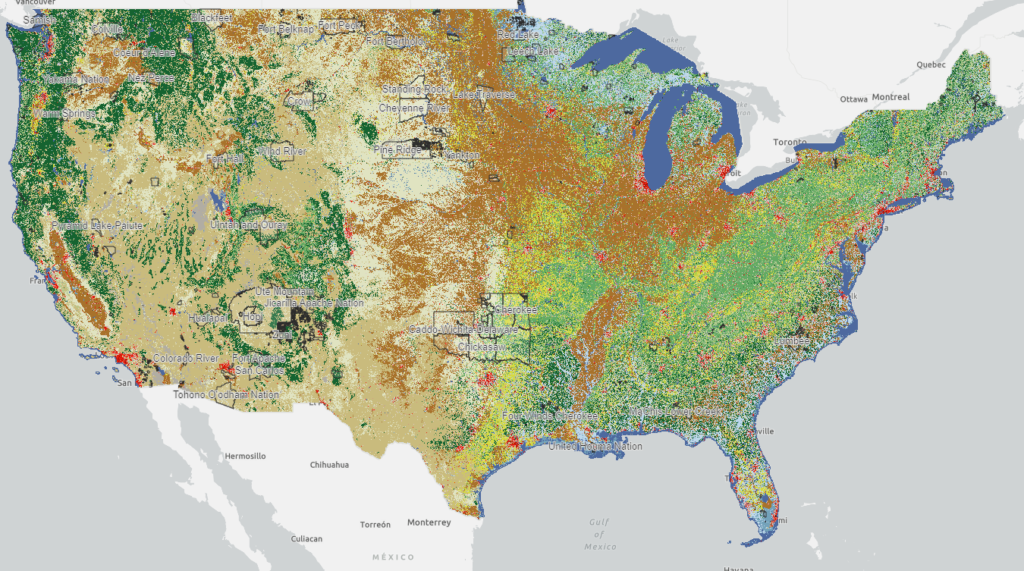
This map viewer visualizes every available year of the National Land Cover Database (NLCD) and makes it possible to filter for 848 native land areas (reservations and off reservation trust lands) in the United States for 2001 and 2019.
What’s Growing on US Native Lands
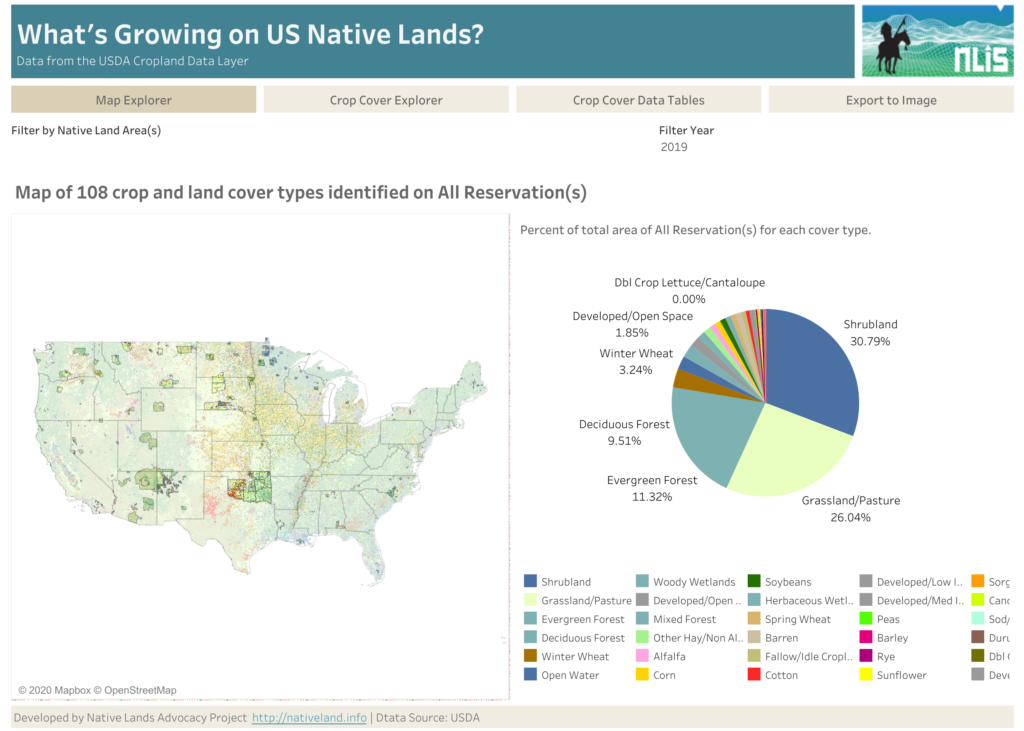
About this Dashboard This data dashboard summarizes data from the USDA Cropland Data Layer for 552 unique native land areas in the coterminous United States for the years 2008, 2012, 2017, 2018, 2019, 2020, 2021 & 2022 and can be filtered for one or more native land area. Cropland Cover Types 0 Native Land Areas […]