By Raven McMullin and Emma Scheerer
Using our Agriculture on Native Lands Data Dashboard, you can now explore the age demographics of Native producers on Native lands!
Through previous blog posts, story maps, and data dashboards, the Native Lands Advocacy Project (NLAP) has embarked on an extensive and critical analysis of the state of agriculture on Native land. In presenting this data (which is sourced from the USDA’s Census of Agriculture for American Indian Reservations) in an accessible and interactive format, we hope that tribal communities can identify positive and negative trends as they seek to expand their cultural, economic, and food sovereignty.
To that end, NLAP has recently added new analytical features to our USDA Census of Agriculture for American Indian Reservations Dashboard. These new features allow users to (1) explore the census data for the total number of Native and non-Native producers broken down by sex and (2) explore the age demographics of Native producers (& non-Native producers) broken down into seven age brackets. This data spans all three years of the USDA’s Census for AIR: 2007, 2012, and 2017.

Observations of Age Demographics
We’ve already shared our observations about the numbers of male and female agriculture producers on reservation land—namely, that Natives have more equal representation of females in agriculture than non-Natives do. You can read those observations here.
Regarding the total number of producers on Native reservations (for reservations who participate in the Census of Agriculture), as well as the age demographics of Native producers, we’ve made two key observations:
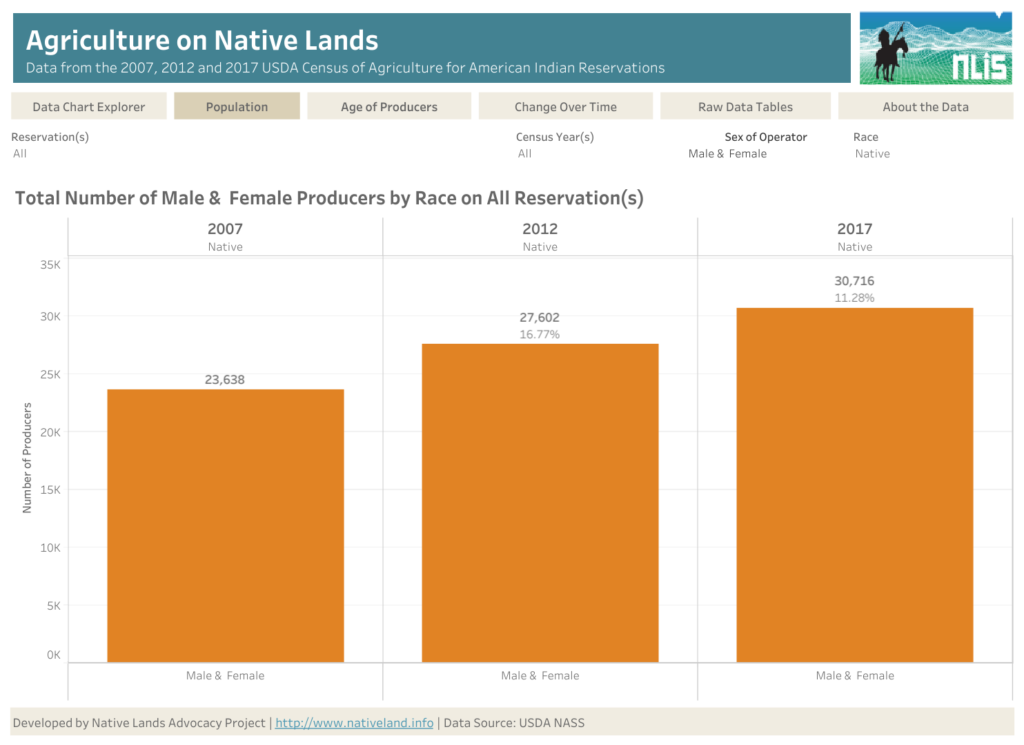
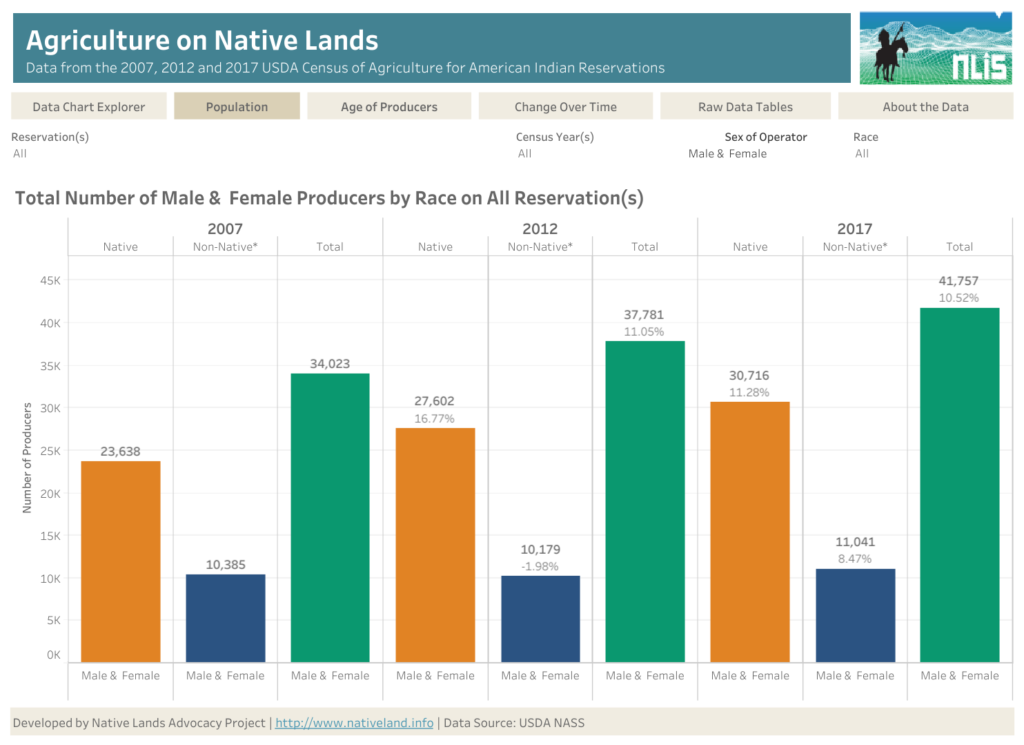
- The total number of Native producers operating on Native reservations has increased 29% from 2007 to 2017, and the total number of non-native producers operating on Native reservations has increased by 6.3%*.
- The 34 and under age group is underrepresented in the total number of Native agricultural producers.
Bear in mind, calculating these totals by utilizing the Census of Agriculture alone can only tell us so much. Total numbers and trends reflected in the Census of Agriculture might be impacted by the fact that the reservations that participate in the Census of Agriculture differ from year to year. We’ve provided more information on data limitations at the end of this blog post.
Nonetheless, this partial glimpse into the data is crucial in understanding the realities of agriculture on reservations. As Native communities and collaborative governmental entities seek to promote a more accessible and supportive agricultural system on reservations, we must understand the condition of young and beginning Native producers.
Analyzing Demographic Data
The first observation made above is encouraging! Across all the census years, the number of Native producers on reservation land has increased by a significant 29%*. Below, we provide infographics taken from our USDA Census of Agriculture for American Indian Reservations Dashboard (in both infographics below, the orange bar represents Native producers).
With our new “Age of Producers” bar plot and line chart, we can also observe how the total number* of Native producers breaks down into seven different age brackets. Below is another infographic taken from our USDA Census of Agriculture for American Indian Reservations Dashboard that shows the age demographics of Native producers.
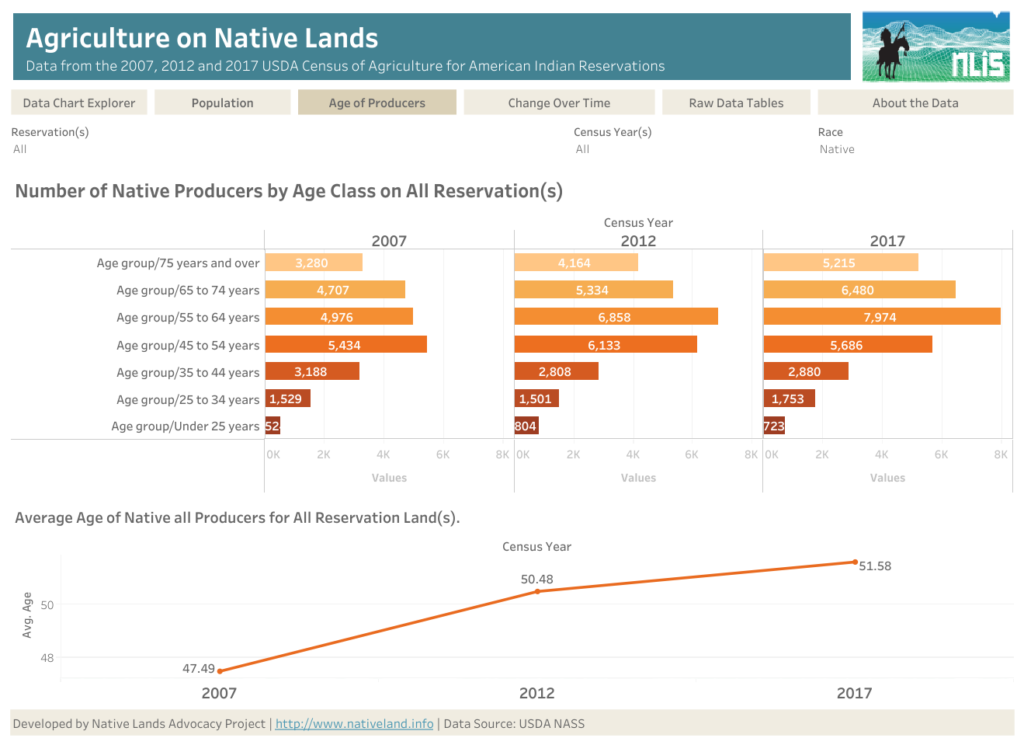
Looking at each year’s data from top to bottom (i.e., from the oldest age brackets to the youngest), it’s evident that Native producers who are 35 years and older consistently outnumber those 34 years and under. The disparity is even greater when comparing Native producers over 35 years old to only those under 25 years old.
To be more specific, Native producers under the age of 35 years old made up only 8% of the total number of producers in 2017. This number falls to just 2.3% when considering only producers under the age of 25. In contrast, agriculture producers over the age of 75 made up 17% of producers in 2017.
Additionally, the graph at the bottom of this infographic demonstrates the average age of Native producers from 2007 to 2017 across all the reservations represented by the census*. This graph clearly shows that the average age of Native producers is consistently rising, even as the total number of Native producers is increasing. Of course, one explanation for this number going up is that some Native producers have been caretaking the land for generations, and the data is simply following many of those same producers as they age. However, it is important to note that younger Native producers are generally not filling the gap being left behind by their aging counterparts.
This data leaves us with several important questions:
- What barriers might prevent Native youth from getting involved in agriculture on their reservations?
- How can tribal communities and collaborative entities support Native youth & provide avenues for getting involved in agriculture?
- What issues will tribes face in the future if the above trends continue, and what do tribes have to gain from slowing or reversing these trends?
Limitations & Importance of Census Data
*As we examine these trends and begin to ask relevant questions about them, we must address a few limitations to this data. First, and perhaps most obvious, is the fact that the USDA Census does not collect data from all 574 federally recognized American Indian tribes. The 2007 Census presents data from 73 reservations, the 2012 Census from 76, and the 2017 Census from 73. Additionally, the reservations counted in the Census differ from Census year to Census year, which might account for the changes in calculated totals. Specifically, 67 reservations participated for all Census years (2007, 2012, and 2017), and 14 reservations only participated in either one or two Census years from 2007-2017.
However, we still believe this data is useful not only for those tribes that do appear on the Census but also for identifying overarching trends in Indian Country’s agriculture. We simultaneously emphasize the importance of tribal communities evaluating their own communities and identifying trends and needs that federal data may not represent.
Another limitation inherent to this data is that the USDA Census reflects a commodified perspective of agriculture that is often incompatible with Native philosophies of food and land. Many traditional practices that are vital for increasing food security will therefore not be represented in these numbers. This gap in the data is one of the reasons we developed the Food-System Transition Index, which seeks to represent the many complex and interlocking factors surrounding food sovereignty for Native communities. That being said, the realities and challenges of commodified agriculture on reservations affect the economies, livelihoods, and futures of Native communities. Further, investing in Native youth who desire to care for their land and produce food for their people is essential for the ongoing well-being of Native American communities.


