This data dashboard summarizes data from future precipitation predictions and historical changes in the snow-to-precipitation ratio on Tribal lands in the contiguous United States. The precipitation predictions are based on datasets from the CRU TS (v. 4.06) and UKCP18 global RCP2.6 scenarios, while the snow-to-precipitation ratio data comes from 177 weather stations spanning from 1949 to 2020. The dashboard features detailed maps and interactive elements, allowing users to explore projected changes in rainfall as well as historical trends in winter precipitation patterns. By providing these insights, the dashboard aims to support resource management and planning for Native communities, offering a valuable tool to understand and address challenges related to climate change and water resource management.
This dashboard includes data from two primary sources: future precipitation predictions and historical snow-to-precipitation ratio changes.
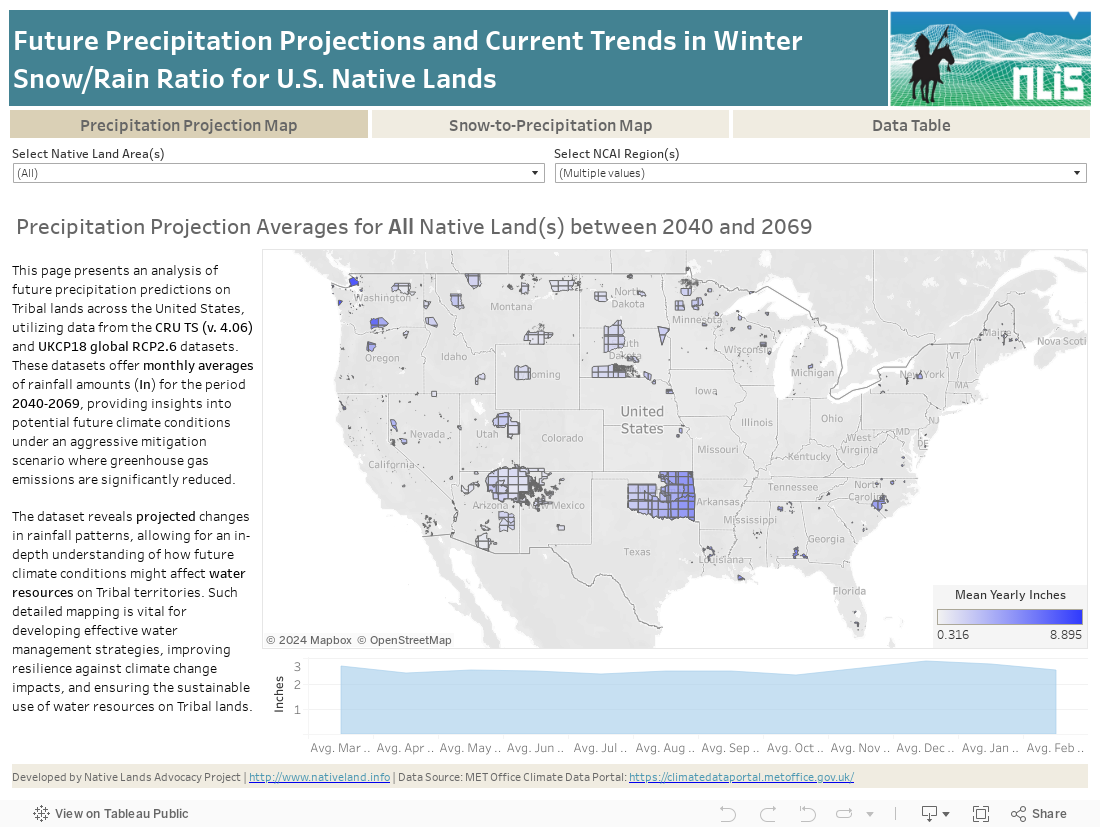
Future Precipitation Predictions: The future precipitation data is derived from the CRU TS (v. 4.06) and UKCP18 global RCP2.6 datasets, which provide monthly averages of rainfall amounts (Inches) for the period 2040-2069. These datasets utilize an aggressive mitigation scenario where greenhouse gas emissions are significantly reduced. The data is provided on a WGS84 grid, measuring approximately 60km x 60km at the equator. This high-resolution data is crucial for understanding potential changes in rainfall patterns and planning for future water resource management on Tribal lands.
Historical Snow-to-Precipitation Ratio: The historical data on the snow-to-precipitation ratio comes from 177 weather stations across the contiguous 48 states, covering the period from 1949 to 2020. This ratio measures the percentage of total winter precipitation that falls as snow. Solid-color circles on the dashboard represent stations with statistically significant trends, highlighting areas where more winter precipitation is falling as rain instead of snow. This data is essential for understanding how changing winter precipitation patterns impact water resources, ecosystems, and winter recreation activities on Tribal lands.
Boundary Data: The boundary data used to define summary areas was obtained from the TIGER/Line Shapefile, 2022, Nation, U.S., American Indian/Alaska Native/Native Hawaiian Areas (AIANNH). This shapefile includes federally recognized American Indian reservations and off-reservation trust land areas, state-recognized American Indian reservations, Hawaiian home lands (HHLs), Alaska Native village statistical areas (ANVSAs), Oklahoma tribal statistical areas (OTSAs), tribal designated statistical areas (TDSAs), and state-designated tribal statistical areas (SDTSAs). We filtered out features that did not intersect with significant precipitation or snow-to-precipitation ratio data to focus on relevant areas, ensuring an accurate representation of Native lands for the analysis.
By integrating these datasets, this dashboard provides a comprehensive view of both future and historical precipitation trends. This information is invaluable for Tribal policymakers, water managers, and communities in planning for and adapting to climate change impacts, ensuring sustainable water use and supporting the resilience of ecosystems and economies dependent on precipitation patterns.
Understanding future precipitation patterns and historical changes in winter precipitation is crucial for managing and protecting Native lands. Precipitation significantly affects water resource availability, land use, and the overall health of ecosystems. This dashboard provides essential insights into projected rainfall amounts for 2040-2069 and historical changes in the snow-to-precipitation ratio from 1949 to 2020. By visualizing these data, tribes can better plan and implement strategies for water management, disaster preparedness, and resource allocation.
The data displayed on this dashboard allows tribes to see which areas are projected to experience changes in rainfall and how historical trends in winter precipitation have shifted from snow to rain. This understanding is essential for developing effective water management strategies, ensuring the sustainability of water resources, and adapting to the impacts of climate change. Additionally, knowing the extent of these changes within each Native boundary provides a broad perspective on the land management challenges and needs of Native communities.
By integrating data from the CRU TS (v. 4.06) and UKCP18 global RCP2.6 datasets for future precipitation, and historical data from 177 weather stations for the snow-to-precipitation ratio, this dashboard offers a comprehensive view of both future and historical precipitation trends. These data, derived from robust and consistent methodologies, provide detailed information that is instrumental in promoting better planning and management of water resources on Native lands.
With climate change posing increasing challenges to water availability and precipitation patterns, this dashboard serves as a valuable tool for tribes to develop resilient water management practices. By understanding both the future projections and historical trends in precipitation, tribes can implement strategies to mitigate water resource risks, enhance resilience to climate change, and ensure the long-term sustainability of their lands and resources. This dashboard supports the goal of promoting effective water and land management on Native lands, helping to secure the future of Native communities and their environments.
While this dashboard provides valuable insights into future precipitation predictions and historical changes in the snow-to-precipitation ratio on Native lands, there are several limitations and considerations to keep in mind:
Resolution of Data: The future precipitation data is provided on a WGS84 grid measuring approximately 60km x 60km at the equator. While this resolution is suitable for broad analysis of regional precipitation patterns, it may not capture fine-scale variations within smaller areas or specific land parcels.
Temporal Coverage: The future precipitation data covers the period from 2040 to 2069, while the snow-to-precipitation ratio data spans from 1949 to 2020. Users should consider the temporal alignment when analyzing the data, as the predictive models for future precipitation are based on scenarios that may evolve. Additionally, the historical data may not capture very recent trends or changes.
Data Integration: Combining datasets from different sources, such as CRU TS (v. 4.06), UKCP18, and weather station data, may introduce inconsistencies due to differences in data collection methodologies, classification systems, and temporal resolutions. Care should be taken when interpreting integrated data.
Snow-to-Precipitation Ratio Metrics: The snow-to-precipitation ratio metrics are derived from historical weather station data. These metrics may not fully capture localized climate variations or the ecological significance of changes in snow-to-precipitation ratios due to variations in regional weather patterns and local geographic features.
Climate Change Scenarios: The future precipitation predictions are based on the RCP2.6 scenario, which assumes significant greenhouse gas emission reductions. This scenario may not reflect other potential future emission pathways. Users should consider additional climate models and scenarios for a comprehensive understanding of future precipitation risks.
By considering these limitations and contextualizing the data within these constraints, users can make more informed decisions and interpretations regarding precipitation trends and water resource management on Native lands.
We have updated our terminology from “raw data” to “source data” to better reflect the contextual nature and origins of the information we provide. This change acknowledges that all data is influenced by the context in which it is collected, and aims to promote a more inclusive and accurate understanding of the information presented.