Available Water in Soil on US Native Lands
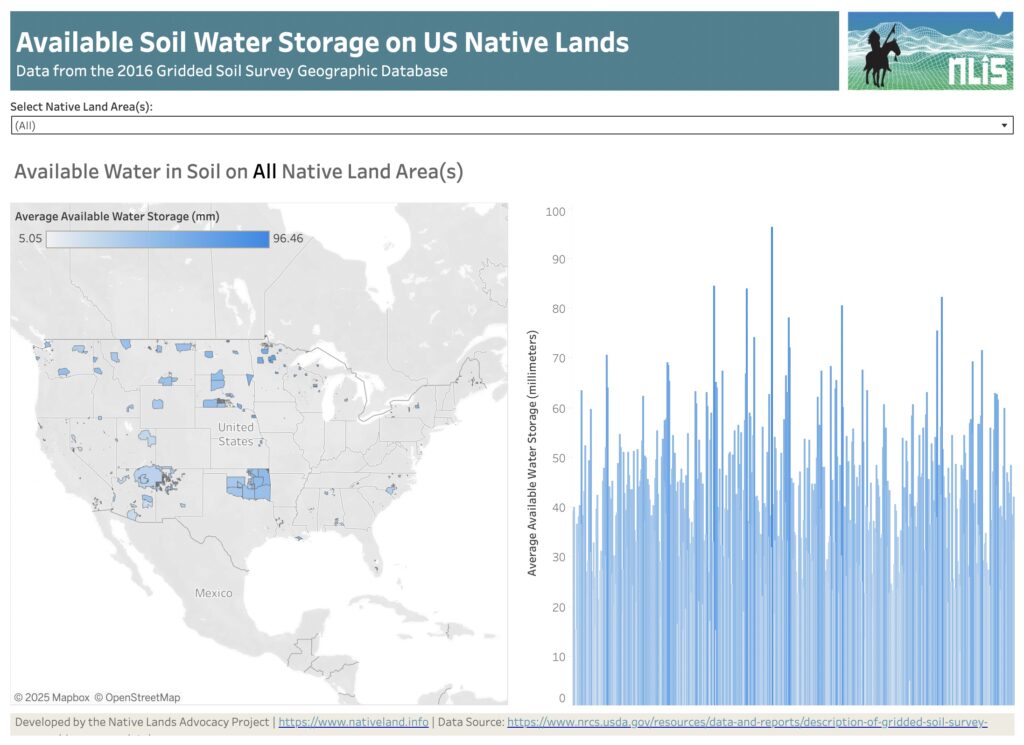
About this Dashboard This dashboard features a reservation-level view of the available water data in soil on all tribal lands in the US. Data comes from the USGS Gridded soil survey for 2016. The “available water in soil” variable from gridded soil surveys refers to the quantity of water that a soil can store and […]
Understanding Wind Speed on Native Lands

Wind plays a significant role in shaping ecosystems, affecting infrastructure planning, and in overall renewable energy potential. Recognizing this, the Native Lands Advocacy Project (NLAP) developed an Average Wind Speed data dashboard as part of our Climate Data Portal for U.S. Native Lands. Read on to learn more about this dashboard and explore two potential […]
New Storymap: Visualizing Federal Spending in Indian Country

Learn about three new data tools that allow users to access relevant data about federal investments in Indian Country.
Credit Insecurity on US Native Lands
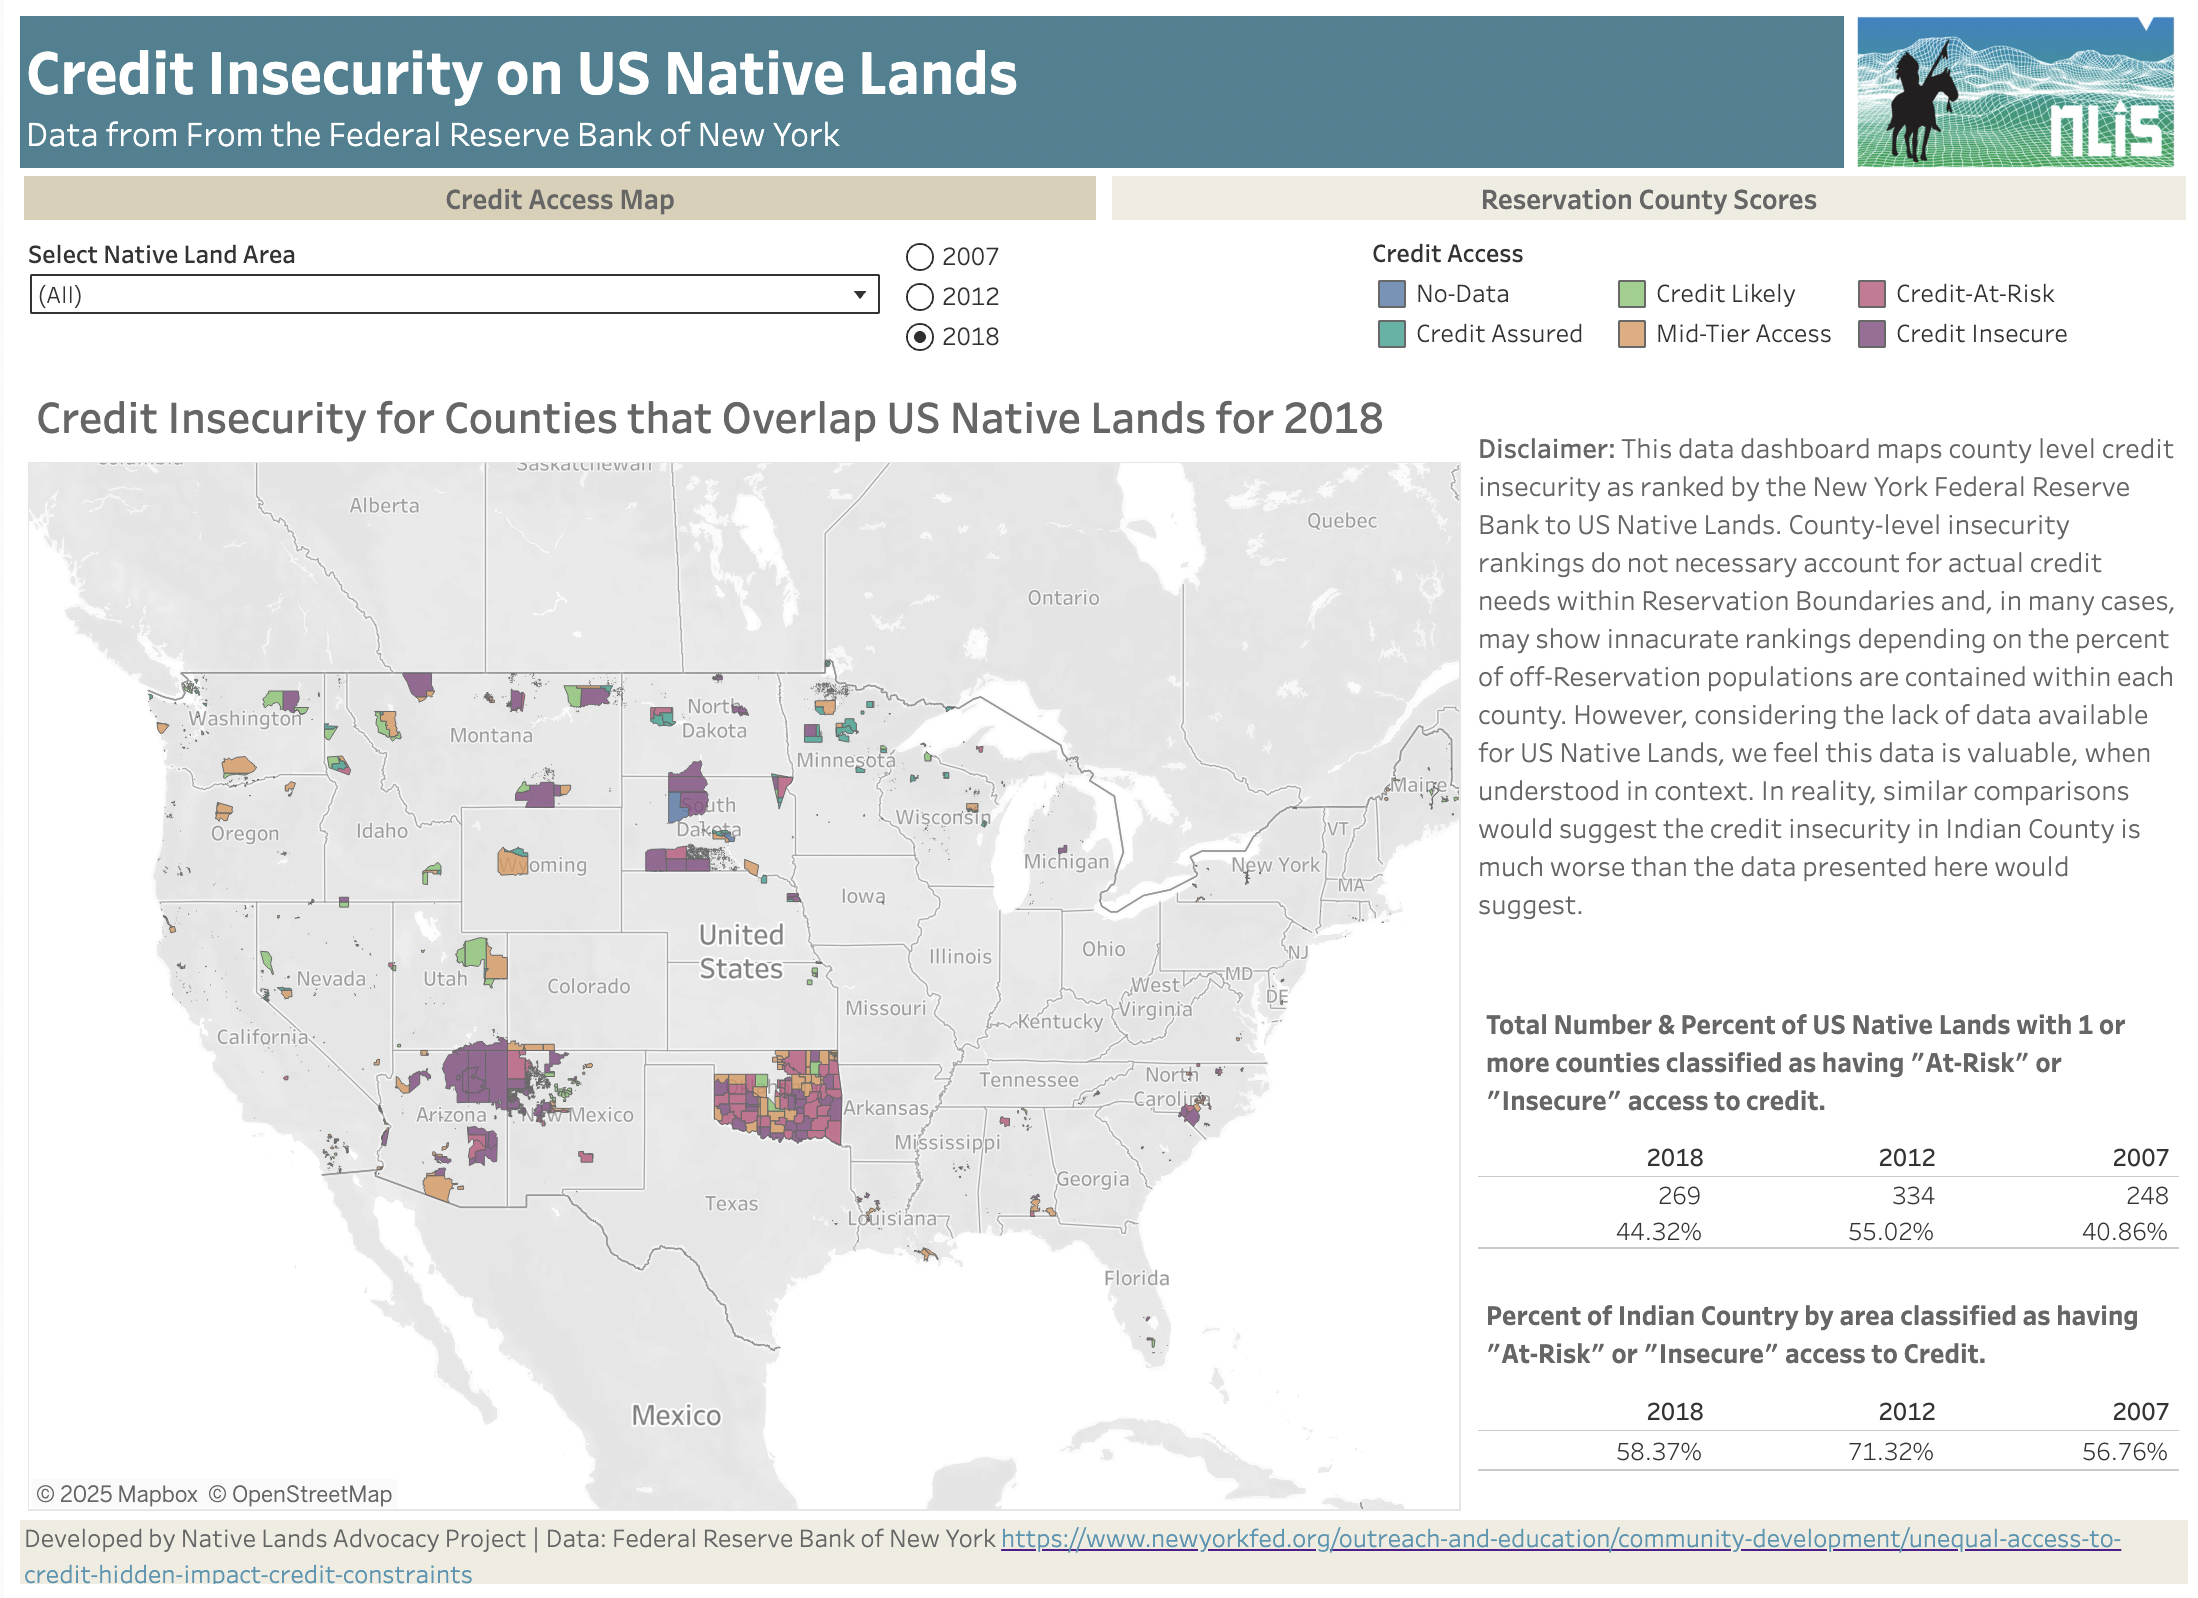
About this Dashboard This data dashboard maps county-level credit insecurity as ranked by the New York Federal Reserve Bank to US Native Lands. County-level insecurity rankings do not necessarily account for actual credit needs within reservation boundaries and, in many cases, may show inaccurate rankings depending on the percentage of off-reservation population contained within each […]
The Impact Project Maps the Effects of Federal Changes on Local Communities
The Impact Project helps equip tribes with relevant information about the real-time effects of federal policy changes on local communities.
Water is Life: Native Efforts to Restore Water Systems

Native American efforts to protect our water systems are integral to the restoration and preservation of this non-human relative.
These Water-Focused Data Tools Support Tribal Land & Climate Planning
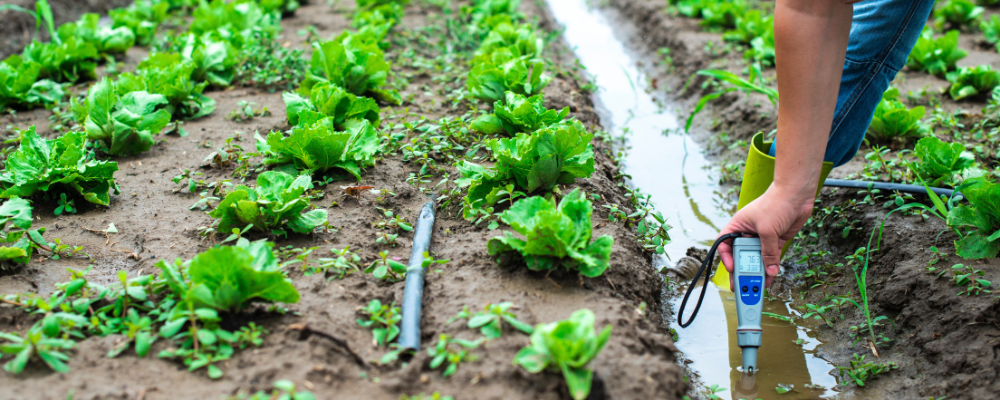
The Native Land Information System (NLIS) is home to over 120 public, free data tools and resources that were created to support tribal communities in developing climate-smart land management strategies. We are excited to share some of our new water data tools with you, as well as reintroduce you to some of our earlier water-related […]
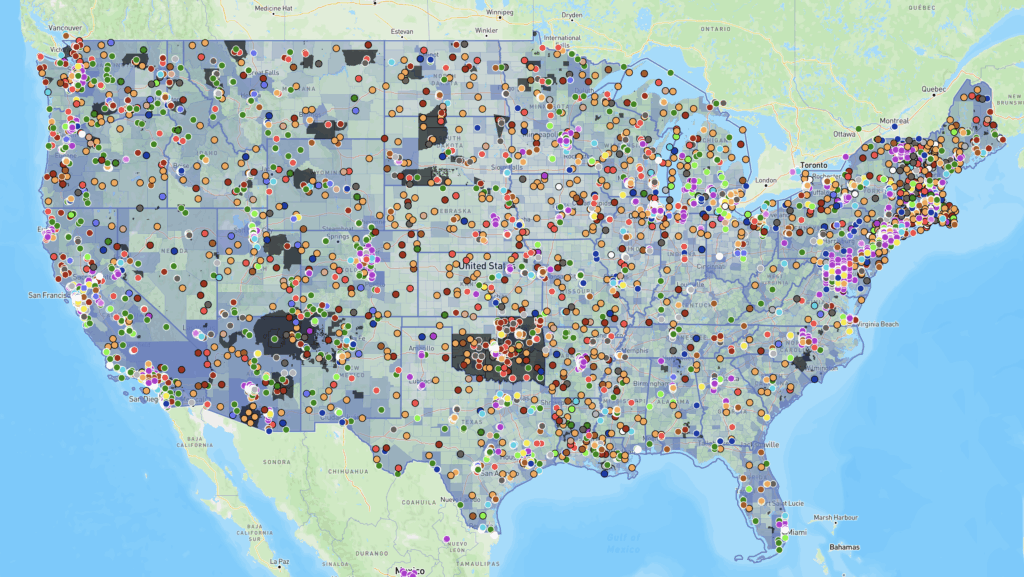
Federally-funded Projects in Indian Country

About this Dashboard This data dashboard summarizes data about federally-funded projects within tribal boundaries from the Bipartisan Infrastructure Law and the Infrastructure Reduction Act. The visualization displays funds amounts and categories of federal project for all tribes for years 2022 through 2025 (it has not been modified for eventual funding freezes resulting from the current […]
Empowering Tribal Climate Adaptation Through Data

Learn more about the first-of-its-kind Climate Data Portal for US Native Lands—designed to strategically support tribal climate planning.
Key Findings from NLAP’s Literature Review of Tribal Climate Adaptation Plans

What climate concerns do tribes across the United States share? How do these climate concerns vary by region? Our Tribal Climate Literature Review identifies preliminary answers to these questions and provides insights to empower tribal climate planning.
Introducing the Climate Data Portal for U.S. Native Lands

The Native Lands Advocacy Project (NLAP) is thrilled to announce the launch of our Climate Data Portal for U.S. Native Lands! Developed with funding from the Native American Agriculture Fund, this portal is the result of our dedicated GIS team’s efforts to create & consolidate relevant climate-related data tools into one living resource. NLAP acknowledges […]
Average Wind Speed on US Native Lands
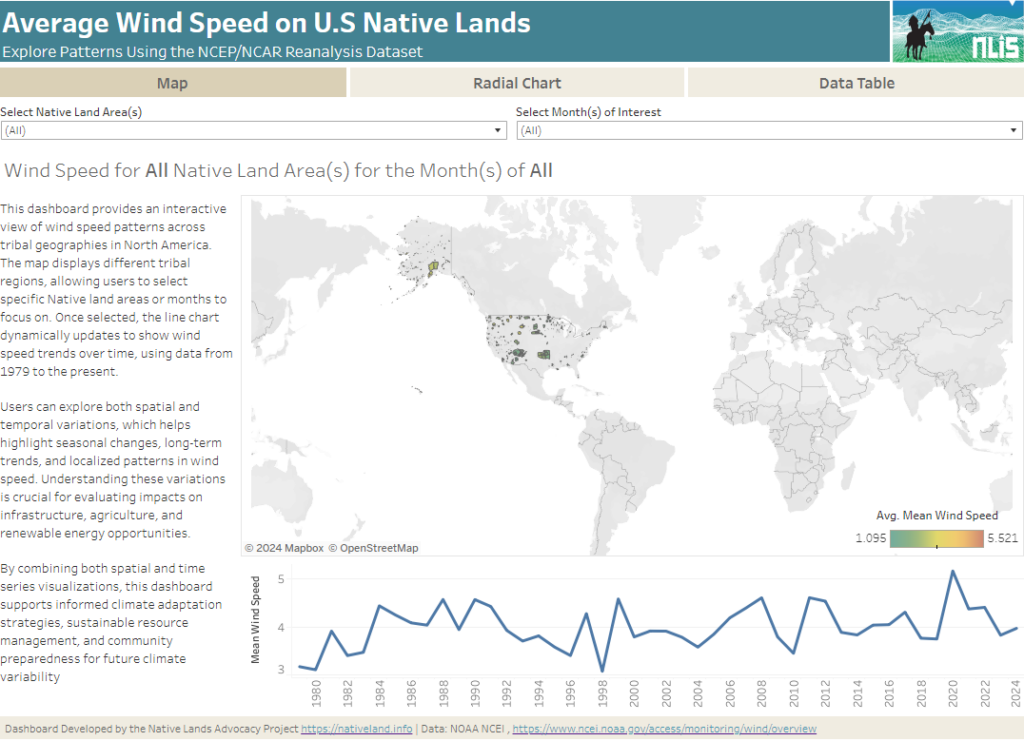
About this Dashboard This interactive dashboard provides a comprehensive analysis of average wind speed patterns across tribal lands in North America, using data from the NCEP/NCAR Reanalysis dataset. The dashboard allows users to explore wind speed trends by selecting specific Native land areas and years, or by viewing aggregated data across all regions and years. […]