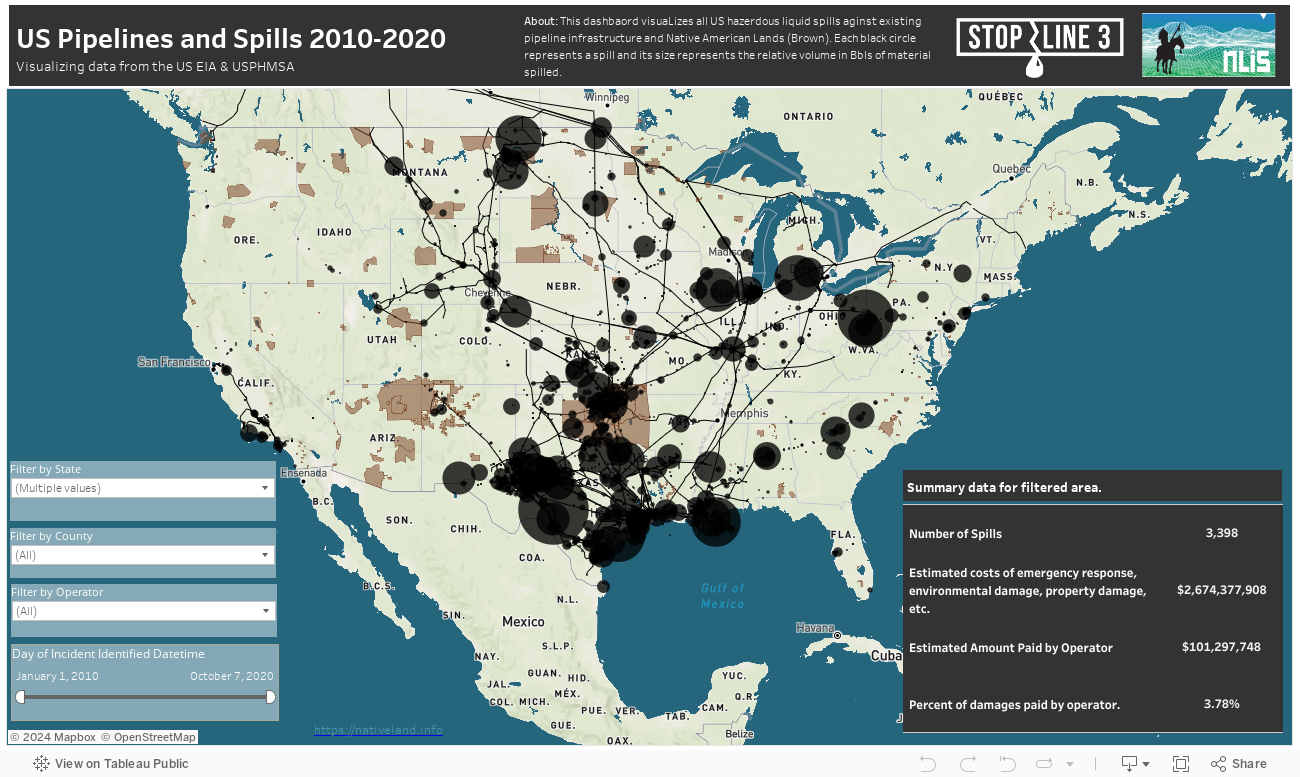
This interactive data visualization developed by the Native Lands Advocacy Project visualizes all hazardous liquid spills in the United States from 2012-2020. It also includes maps of major pipelines and boundaries of contemporary Native lands. Spills are symbolized by black circles, and the size of the circle is relative to the volume hazardous liquids unintentionally released during the incident. The data can be filtered by date, state, county, and operator. Totals for number of spills, costs, amount paid by operator, and percent paid by operator updates automatically based on filter.
“Title 49 of the Code of Federal Regulations (49 CFR Parts 191, 195) requires pipeline operators to submit incident reports within 30 days of a pipeline incident or accident. The CFR defines accidents and incidents, as well as criteria for submitting reports to the Office of Pipeline Safety. The following kinds of information are collected:
Specific information includes the time and location of the incident(s), number of any injuries and/ or fatalities, commodity spilled/gas released, causes of failure and evacuation procedures. The reports are used for identifying long- and short-term trends at the national, state and operator-specific levels. The frequency, causes, and consequences of the incidents provide insight into the safety metrics currently used by PHMSA, state partners, and other pipeline safety stakeholders, including the pipeline industry and general public. PHMSA also uses the data for inspection planning and risk assessment.”
The data from these reports can be obtained in a machine readable format from the US Department Transportation’s Pipeline and Hazardous Materials Safety Administration’s website at https://www.phmsa.dot.gov/data-and-statistics/pipeline/distribution-transmission-gathering-lng-and-liquid-accident-and-incident-data
The map of Crude Oil Pipelines was obtained from the US Energy Information Administration (US EIA) and was included for reference purposes only. The dataset includes “major crude oil pipelines in the United States and selected crude oil pipelines in Canada. The map layer includes interstate trunk lines and selected intrastate lines but excludes gathering lines. Based on publicly available data from a variety of sources with varying scales and levels of accuracy. This layer is not visible if zoomed in beyond 1:1,000,000 scale.” According to the US EIA, the dataset was updated 4/28/202.
The National Environmental Policy Act (NEPA) 42 U.S.C. §4321 et seq. (1969), the International Labour Organization Convention (ILO) 169, and the UN Declaration on the Rights of Indigenous Peoples require the meaningful participation of indigenous communities when they may be affected by development activities. Specifically, the National Environmental Policy Act (NEPA) directs federal agencies to assess the potential environmental effects of their proposed major actions significantly affecting the human environment and inform the public about those potential effects.
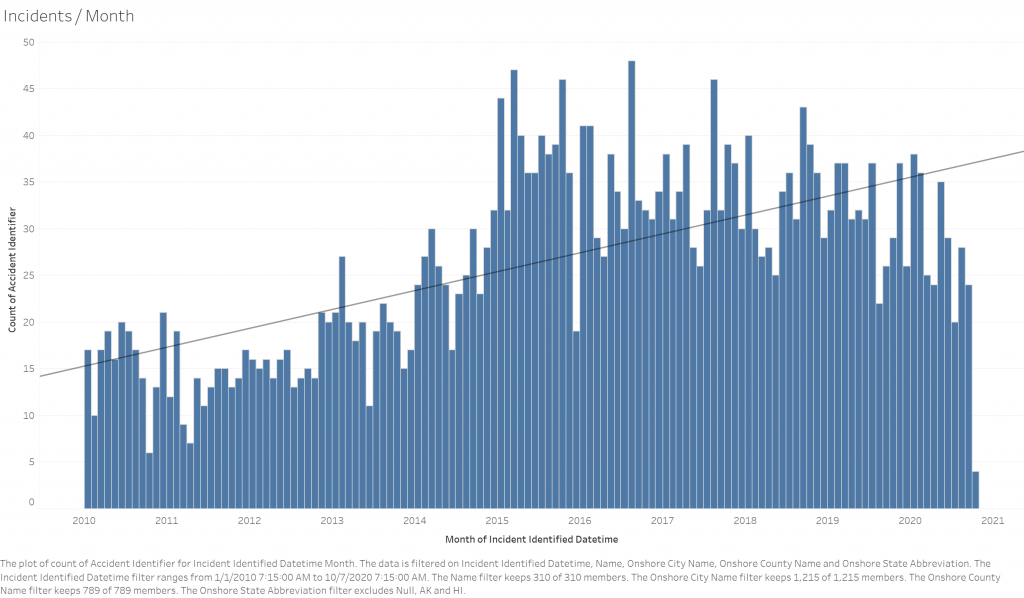
This data visualization may be utilized by Tribes and the public to assess and raise awareness about the actual track record of producers. For example, Between 2012 and 2020, there has been an increase in the monthly average number of spills. Additionally, the total quantifiable costs of the spills totaled $2.64 billion operators only paid $101 million or only 3.78% of those costs.