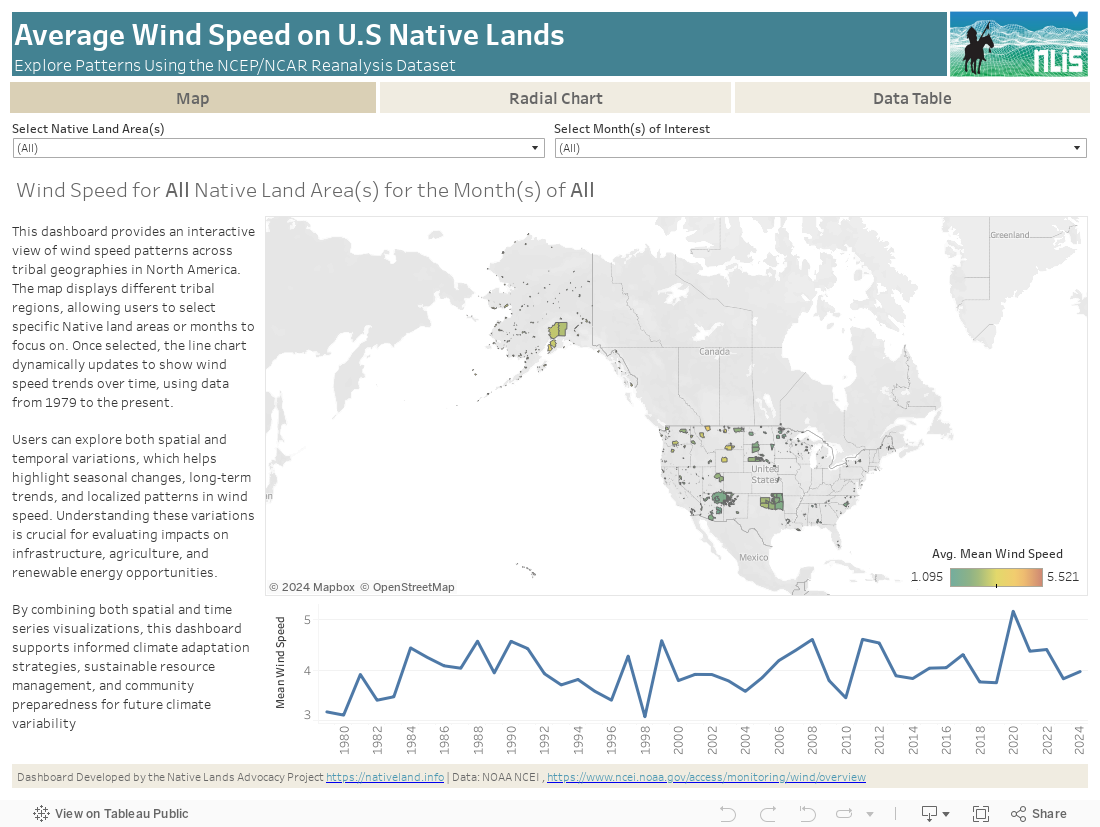
This interactive dashboard provides a comprehensive analysis of average wind speed patterns across tribal lands in North America, using data from the NCEP/NCAR Reanalysis dataset. The dashboard allows users to explore wind speed trends by selecting specific Native land areas and years, or by viewing aggregated data across all regions and years.
The dashboard offers multiple visualization options:
By offering insights into both seasonal and long-term wind patterns, the dashboard supports decision-making related to resource management, infrastructure planning, and climate adaptation on tribal lands. Understanding wind dynamics is essential for renewable energy opportunities, environmental protection, and community resilience in the face of climate variability.
This dashboard is built using wind speed data from the NCEP/NCAR Reanalysis dataset, which provides detailed information on wind speed and direction. The wind speed data comes from the U.S. Wind Climatology – Monthly dataset, which offers average monthly wind speeds for the contiguous United States from 1979 to the present. The dashboard presents the average wind speeds, calculated by combining the U-wind (east-west component) and V-wind (north-south component) data. These climatological mean wind speeds are averaged over the previous three decades, providing a clear view of typical wind conditions across tribal lands.
The NCEP/NCAR Reanalysis project uses a computer model of Earth’s atmosphere, combined with global atmospheric pressure measurements, to estimate wind speeds dating back to 1948. In this dashboard, the wind speeds are presented as monthly averages, derived by combining the U-wind and V-wind components to give a comprehensive understanding of wind patterns.
The geographic boundaries used in the dashboard are based on data from TIGER/Line Shapefiles for American Indian/Alaska Native/Native Hawaiian Areas. These boundaries include federally recognized American Indian reservations, off-reservation trust lands, state-recognized reservations, and other tribal statistical areas. This ensures that the wind speed data is accurately contextualized for tribal lands, allowing users to analyze wind patterns specific to Native geographies.
By integrating these datasets and offering multiple visualization options—including a map viewer, time series, radial chart, and raw data table—the dashboard provides users with the ability to explore wind patterns across tribal lands for different years and months, identify both seasonal and long-term wind speed trends, and access the full dataset for more detailed analysis. This data is crucial for tribal leaders, policymakers, and resource managers as they assess the impacts of wind on infrastructure, renewable energy projects, and climate adaptation efforts.
Understanding wind speed patterns is essential for managing and protecting Native lands, as wind plays a significant role in shaping ecosystems, infrastructure planning, and renewable energy potential. This dashboard provides critical insights into average wind speeds across tribal lands, using historical data from the NCEP/NCAR Reanalysis dataset spanning from 1979 to the present.
By visualizing these wind speed patterns, tribes can identify trends over time and make informed decisions related to infrastructure resilience, energy development, and environmental protection. Wind speed is a key factor in the feasibility of renewable energy projects, such as wind farms, which are vital for fostering sustainable energy independence on Native lands. Additionally, the impact of wind speeds on land use and natural resource management underscores the need for careful planning in the face of climate variability.
This data allows tribal leaders and communities to explore regional differences in wind speeds and analyze how these patterns shift over time. Knowing how wind speed trends vary across different areas helps identify risks and opportunities for infrastructure and resource management, enhancing climate adaptation strategies. The ability to track wind patterns seasonally and across multiple years provides a broader understanding of how climate change may affect these conditions on Native lands.
By combining the U-wind and V-wind components to present average wind speeds, this dashboard offers an accessible and comprehensive tool for tribal planners, policymakers, and resource managers. The detailed wind speed data supports tribes in developing strategies for renewable energy production, strengthening infrastructure, and mitigating the impacts of changing climate conditions.
As climate change continues to bring uncertainty, this dashboard empowers tribes to adapt and plan for future challenges, helping to secure the resilience of Native communities and their environments.
While this dashboard offers valuable insights into wind speed patterns across Native lands, there are several limitations and considerations to keep in mind:
Resolution of Data: The wind speed data used in this dashboard is provided at a resolution of approximately 2.5 degrees latitude/longitude, which is suitable for analyzing regional wind patterns over large areas. However, this resolution is not high enough to capture fine-scale wind variations within smaller land parcels or to precisely determine the ideal placement of wind generation infrastructure. For such purposes, more detailed, localized data would be required.
Temporal Coverage: The wind speed data covers the period from 1979 to the present, offering insights into long-term trends. However, users should be mindful of any recent changes in wind patterns that may not yet be reflected in the data, especially as wind speeds can be influenced by both short-term weather variability and long-term climate shifts.
Data Integration: The data in this dashboard is derived from the NCEP/NCAR Reanalysis dataset, which combines historical atmospheric pressure measurements with computer models to estimate wind speeds. While this provides a consistent and reliable dataset, the integration of model data and observational records may introduce some discrepancies due to differences in data collection methods and temporal resolution.
Wind Direction Components: The dashboard presents average wind speeds derived from the combination of U-wind (east-west) and V-wind (north-south) components. However, users should consider that localized wind dynamics, which can be influenced by topography and other geographic features, may not be fully captured at this resolution.
Climate Variability: Wind speeds can be highly variable, influenced by seasonal changes, climate variability, and broader atmospheric patterns. While the dashboard provides a useful tool for understanding historical wind trends, users should consider that future wind conditions could be affected by changing climate conditions, which may alter wind patterns over time.
By acknowledging these limitations and interpreting the data within these constraints, users can make more informed decisions about wind patterns and their implications for resource management, renewable energy development, and climate adaptation on Native lands.
We have updated our terminology from “raw data” to “source data” to better reflect the contextual nature and origins of the information we provide. This change acknowledges that all data is influenced by the context in which it is collected, and aims to promote a more inclusive and accurate understanding of the information presented.