Soil Organic Carbon Planning, Key to Building Tribal Climate Resiliency
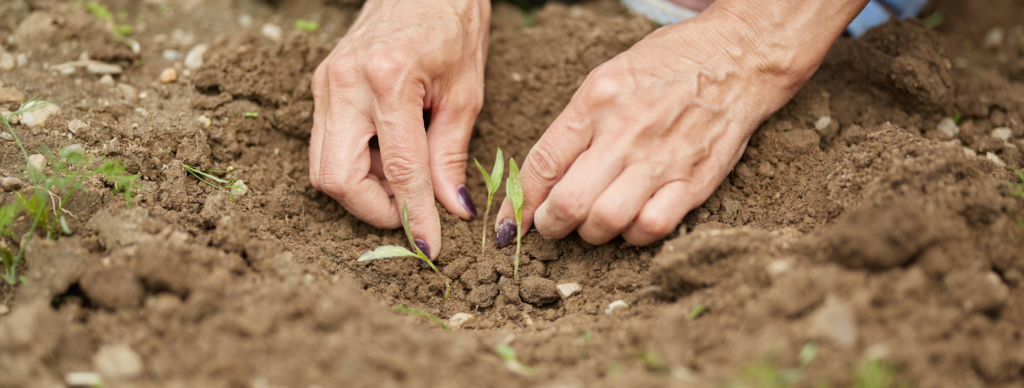
As tribes continue to experience the impacts of climate change on their lands and communities, they are starting to invest more of their resources and planning strategies into protecting and enhancing their soil organic carbon (SOC). In this blog post, we discuss ways that tribal land caretakers can use our Soil Organic Carbon Dashboard, which […]
Energy & Mineral Revenue From US Native Lands (2008-2020)
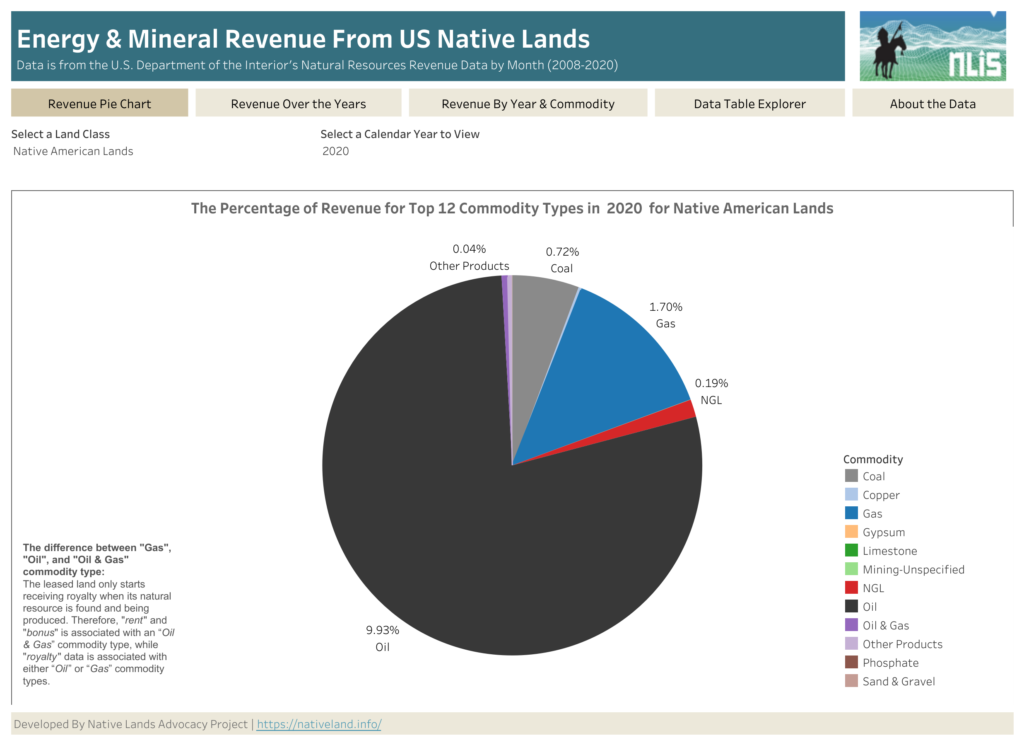
About this Dashboard This data dashboard, developed by the Native Lands Advocacy Project, summarizes data from the US Department of Interior’s Office of Natural Resources Revenue (ONRR) for US Native Lands for the period of 2008 through 2020. This dashboard also has the data for all federal lands. 0 Resource Types 0 Land Class 0 Years of […]
Assessing Food Resilience on Native Reservations: the Good Food Access Indicator
If you do a quick Google search of food access on Native American reservations, odds are that you will find a plethora of articles that summarize the reservation food narrative using the following keywords: “food desert,” “food insecurity,” and “food poverty.” Although recognizing this reality is important –and the necessary first step to securing federal […]
Cropland Diversity on Native Lands
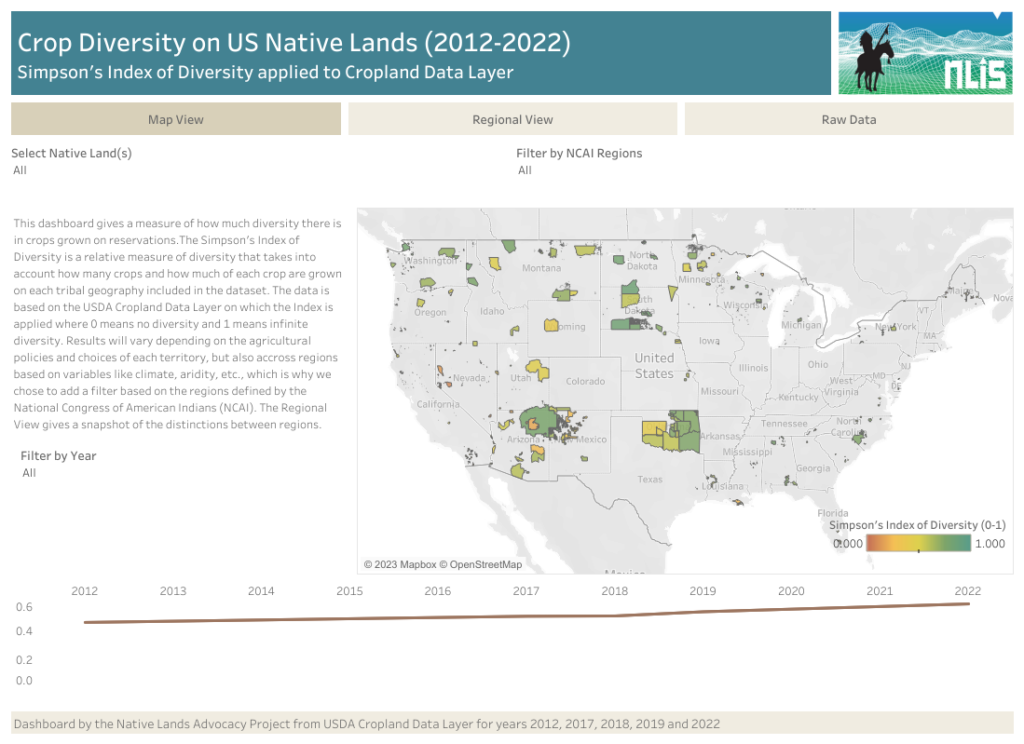
Please note that the Cropland Diversity Dashboard page is currently down on our website, but can still be accessed on Tableau here. We’re working on resolving this issue as quickly as we can. Contact us at info@nativeland.info if you have any questions. Our new Cropland Diversity data dashboard is the first index of Cropland Diversity […]
The Power of Asdzáán in Agriculture: Data Shows Native Female Majority Among Navajo Operators

By Raven McMullin Previously, in one of our most popular blog posts, NLAP highlighted the prominence of female-led agricultural operations on Native reservations: The data [from our Agriculture on Native Lands Dashboard] shows that women comprise over 50% of the Native American Farmers and Ranchers operating on Native American Reservations and nearly 46% of the […]
Rez Croplands: How Native Farmers and Ranchers Can Leverage the USDA’s Cropland Data Layer for Land Planning
According to summary statistics from the USDA’s Cropland Data Layer (CDL), there were about 110 million acres of cropland (5.7%) on Native American reservations (including on-reservation and off-reservation trust lands).* What are these croplands and land covers? How have they changed over time? Why does this data matter? NLAP’s What’s Growing on US Native Lands […]
Quantifying Disparities in Agricultural Revenue on Native Lands
According to our Lost Agriculture Revenue Database, non-Native farmers have made $749,517,889,778 in agricultural revenue (85.7% of total revenue) on Native reservations since 1840, while Native farmers have made $125,018,539,082 (14.3% of total revenue). What factors contribute to this shocking disparity in agricultural revenue? And what do these numbers really represent for Native communities? A […]
International Day of Biological Diversity: Data Tools for Indigenous Stewardship

The United Nations has proclaimed May 22 to be the International Day of Biological Diversity, or World Biodiversity Day. Today we celebrate the rich diversity of the earth’s lifesystems and recognize that biodiversity is “directly related to the resilience and ability of [a] system to sustain itself in the face of a changing environment” (Johnson […]
NLAP Collaborates on Special Journal Publication About Tribal Data Sovereignty

Published in the most recent Environment and Planning F issue, NLAP and leading Indigenous scholars Joseph P. Brewer II, Stephanie Russo Caroll, and Michael Kotutwa Johnson write about tribal data accessibility and equity in “Life and Times of Data Access: Regarding Native Lands.” At a time where reliable data are considered paramount to successful projects, […]
Introducing New Resource Tools for Grassland Protection and Restoration
NLAP is happy to announce two new resource tools for grassland and biodiversity protection: our storymap, Grasslands: The Land and the People that Call it Home, and our Conservation Reserve Program Dashboard! Together, these tools explore the history of one of the land’s most precious communities and opportunities for their continued restoration. Grasslands Storymap Before […]
Announcing Our New Storymap: Building Up Native Youth in Agriculture
How well-represented are Native youth in the overall population of Native agriculture producers? What difficulties do Native youth face when entering agriculture, and what resources exist to support and empower them? The Native Lands Advocacy Project (NLAP) is happy to announce our new storymap exploring these questions: Building Up Native Youth in Agriculture! One of […]
Conservation Reserve Program
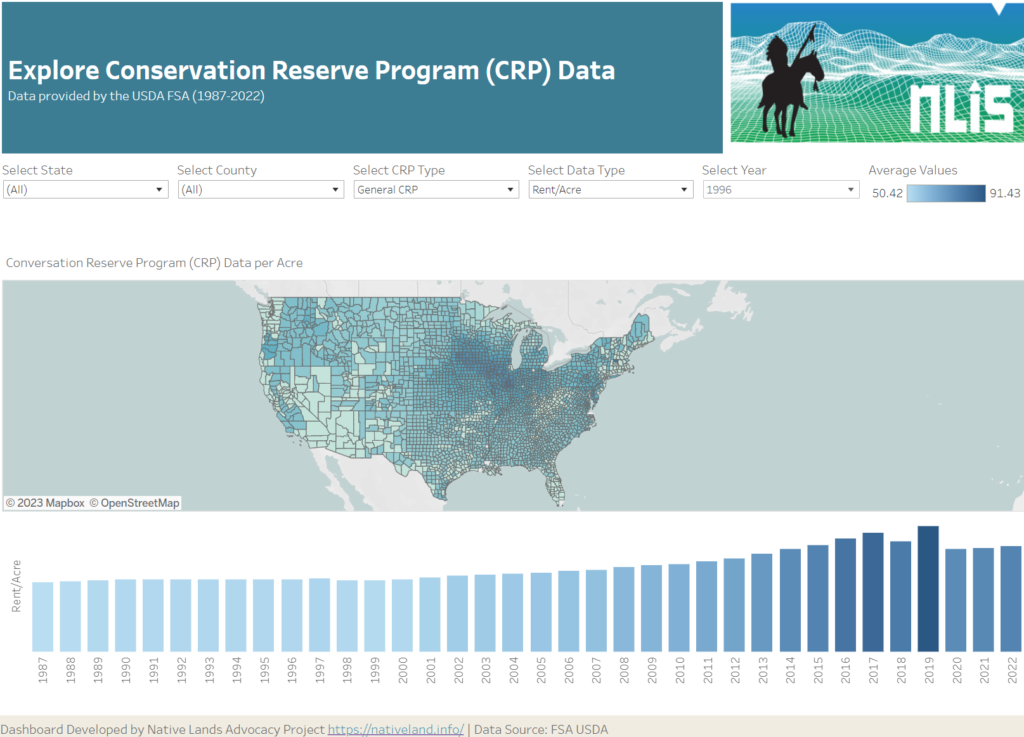
About this Dashboard This data dashboard summarizes data from the USDA FSA conservation reserve program (CRP) for every eligible county in the United States since the program’s inception in 1986 (data for years 1987-2022). The data in this dashboard shows state and county averages in addition to yearly enrollment and rent totals. 0 Years of […]