About the Top 10 Dashboard
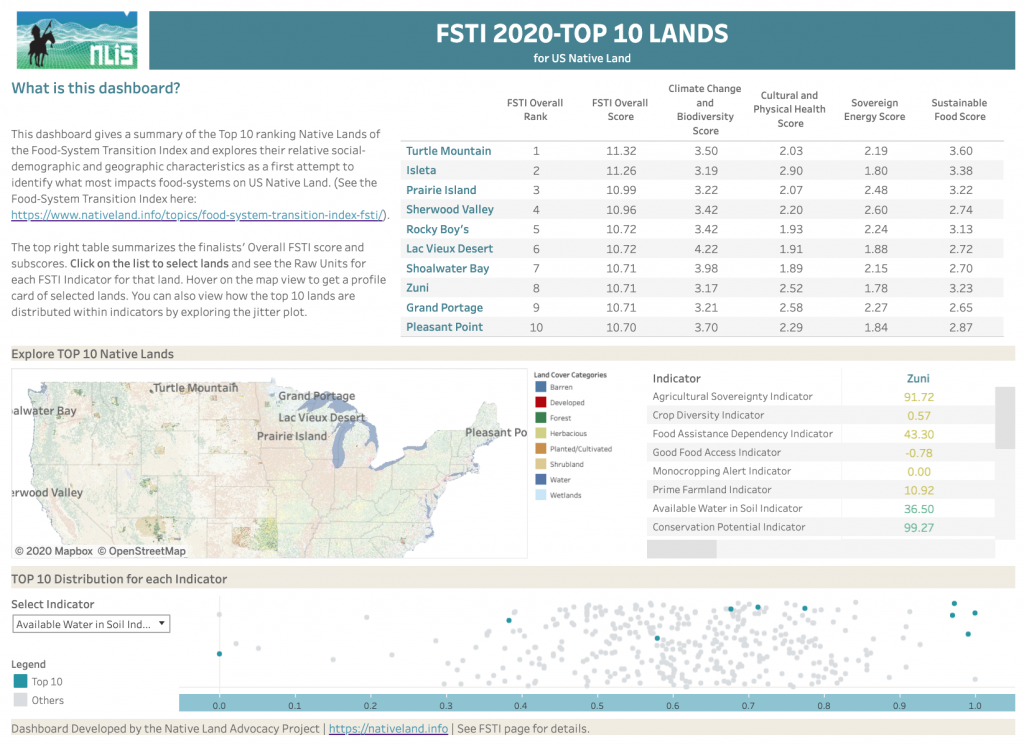
NLAP created the FSTI Top 10 dashboard for two primary reasons:
- To show the top 10 highest ranking lands of the 2020 FSTI
- To explore their profiles and characteristics, and observe possible explanations for their high scores
The sample is too small to make any kind of statistically significant inferences, but it is a first step toward identifying possible trends. We collected additional social-demographic, historical, economic, and geographic data for these top-ranking lands to complete their FSTI characteristics. It is striking to realize that these territories vary greatly across all variables, which raises very important questions for Native food sovereignty and food policy-making on U.S. Native lands.
These figures reveal that commonly held assumptions about the effects of market economy, population density, and geography on food systems are greatly insufficient to explain why these territories seem to have the greatest food sovereignty among U.S. Native lands. However, many food policies are based on such measures. More research is critically needed to better identify what factors impact food systems and how this can best inform tribal decision-making.
How Does the Top 10 Dashboard Work?
- See the top 10 ranking in the upper right corner of the dashboard
- Select the land you are interested in exploring further
- Look at the raw unit details for each indicator in the land(s) you’ve selected
- Hover over the map view to see each lands’ social-economic and geographic profiles
- View the jitter plot at the bottom of the dashboard to explore the relative data distribution of the Top 10 within each indicator