This data dashboard, developed by the Native Lands Advocacy Project summarizes Interests on Farm Debt paid by Agricultural Producers on Native Land by Race and plots it on agricultural revenue to determine exactly how much lending impacts revenue. Data comes from 2017 USDA Census of Agriculture for American Indian Reservations for 75 unique Native land areas in the coterminous United States.
It is widely understood that Native Agricultural Producers face discrimination to access capital to fund projects on their own land, as brought into light by the 2018 Keepseagle Settlement. While there is no official data allowing to assess the breadth of this discrimination, we know it has played an important role in keeping Native farmers and ranchers as minority operators on their own reservation lands, along with the Land Tenure system which has long favored leasing out land to non-native Producers. As we previously demonstrated in our dedicated dashboard, while most ranchers are native on US Native land, 90% revenue is captured by non-native farmers. Highlighting these mechanisms is hugely important to support the struggle towards full Native control of Native land in the US. It is a matter of social justice, but also a matter of climate justice, as Native producers tend to encourage practices with lesser ecological impacts than non-native farmers, mostly due to more integrated ecological worldviews (see Bison Dashboard).
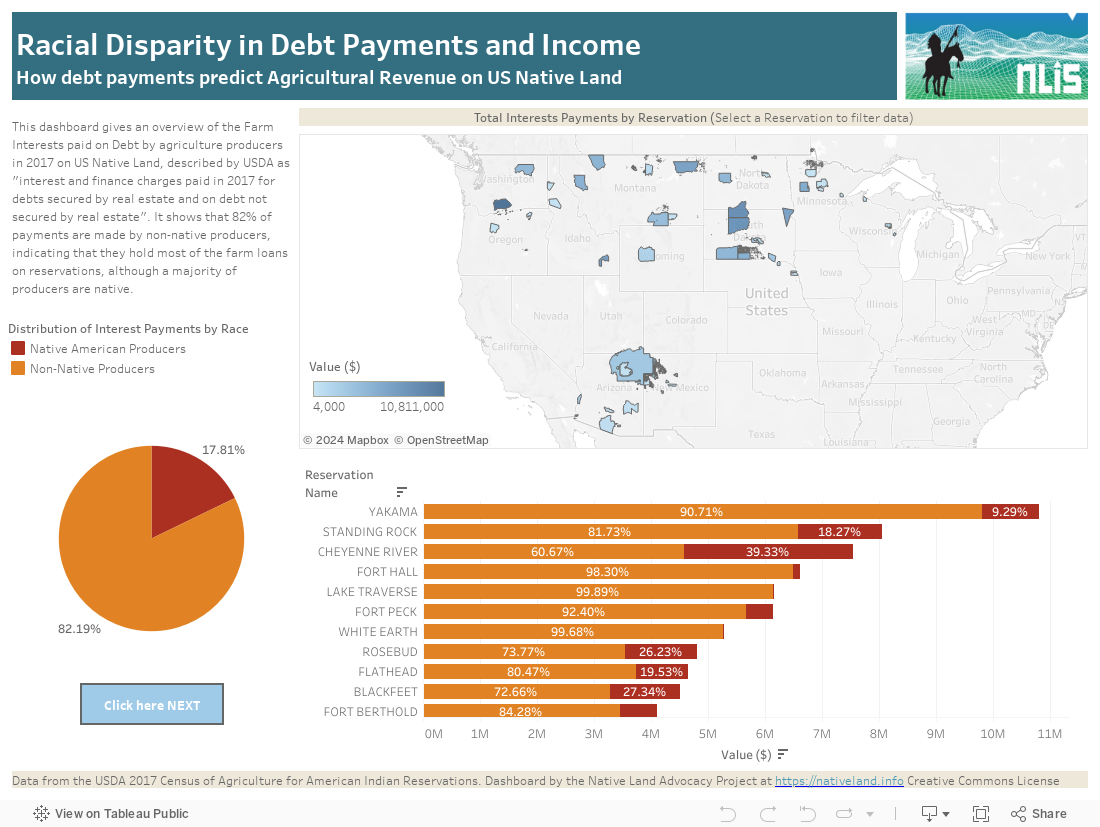
This dashboard explores the USDA 2017 Census of Agriculture for American Indian Reservations with a special focus on Farm Loans and their role in predicting Farm Revenue, by looking at “Interests Paid on Debt”, described as “interest and finance charges paid in 2017 for debts secured by real estate and on debt not secured by real estate”, as proxy to measure access to farm loans. The analysis on the front dashboard shows that more than 82% of farm debt is held by non-native farmers on US Native Land, which makes sense given the racial disparity in lending practices.
But what exactly is the relationship between access to loans and agricultural revenue? To find answers, we plotted Interests payments to the total agricultural revenue, and compared this relationship across producers’ race. The model shows that farm debt payments explain about 83% of the variation of Agriculture Revenue. Results are extremely statistically significant and consistent throughout reservations and across race.
This analysis allows us to confirm important trends. Firstly, enabling access to loans seems extremely important to increase the share of agricultural revenue by Native producers on reservation, and redress the current disparity where 90% of the revenue is captured by non-native farmers and ranchers while the majority of producers are Native. However, while this relationship shows the capacity of debt to produce more capital, it cannot serve to make inferences about the quality of local food-systems. It can, however, serve as information to redress the structural injustices still occurring on Native land today.
There is an extreme lack of data to understand the breadth and extent of agriculture on Native Lands in the United States. Most of the agriculture data collected by the United States Government is aggregated at the State and County levels and because Native lands often overlap state and county boundaries, it makes it extremely difficult to get accurate totals for just Native lands. Starting in 2002, the USDA began collecting agriculture data for a limited number of American Indian Reservations, only 75 in the most recent 2017 census. The first year was only a pilot study that included Reservations in Montana, South Dakota, and North Dakota and this expanded in 2007 and 2012. The 2012 Census included data for only 76 reservations and the 2017 census includes data for only 75. While this provided invaluable data compared to before, the data is self-reported by individual producers and thus it is likely incomplete. The Census for American Indian Reservations includes all farms and ranches within the boundaries of the Reservation but does not not distinguish between farmers and ranchers operating on Trust land with those operating in fee or deeded lands within Reservation boundaries.
Additionally, the format of publication by the Census makes it hard to extract relevant information. The published reports only quantified each variable for “Native” and “Reservation Total” and failed to report statistics for “Non-native” which conceals the extreme disparity that exists on Native American Reservations. While we have submitted a special tabulation request to the USDA NASS for the data on non-Native operators, in the mean time, we have included a provisional calculation for “Non-native” producers, making it possible to analyze the racial disparity in agriculture on Native Lands.
This dashboard participates in emphasizing the racial distribution of agriculture practices in Native Land and completing the long puzzle of documenting historical and contemporary structural oppression on US Native Lands. It suggests that most farm debt is held by non-Native Producers on US Native Lands. It also shows how much access to loans increases agricultural revenue. This is consistent with our data about the general racial discrimination in agricultural production and revenue in Native Land. More research is needed to establish the long-term effects of discriminatory lending practices on contemporary agricultural production. Keep tuned for more pieces of the puzzle on the Native Land Information System.