The Good Food Access Indicator is a composite score that provides an assessment of both access
This indicator is the overall composite score of two standardized measures:
The data was processed and aggregated at the reservation level using QGIS and further processed into excel and Tableau to build user-friendly visualizations. Boundary data used to define summary areas for both measures was obtained from the 2019 US Census Bureau’s TIGER/Line Shapefile for American Indian areas in the United States which includes both American Indians and Alaskan Natives, a total of 845 unique features or land areas including On-Off reservation. For the FSTI indicators, we use the AIANNHCE aggregation level, which combines both On-Off reservation areas and gives a final output of 658 native land areas. (See ‘Methods’ section below for more details).
Food security remains a prevalent issue on Native land. The complex land tenure system makes local food production very difficult by taking land control out of the hands of native food producers. Local agriculture is thus usually geared towards low nutrition cash crop production, and this system leaks most agricultural revenue outside the reservation. Additionally, economic hardships and discriminatory lending practices make it hard for residents to establish local food stores, and enables the installation of poorly nutritious fast-food chains. These patterns qualify many Native lands as food deserts.
But this is not the whole story! Although these inequalities explain real challenges occurring on US Native land, the data about food-systems, or absence thereof, tells us more. Datasets that list local initiatives are supposed to give visibility to the blooming native food movement. However, because the available nationwide datasets mostly come from the USDA, they have inherent limitations:
Therefore, this indicator participates in challenging these narratives. It points at how data can empower local food-systems and sovereignty on US Native land.
The potential of this data can be best exemplified by the following:
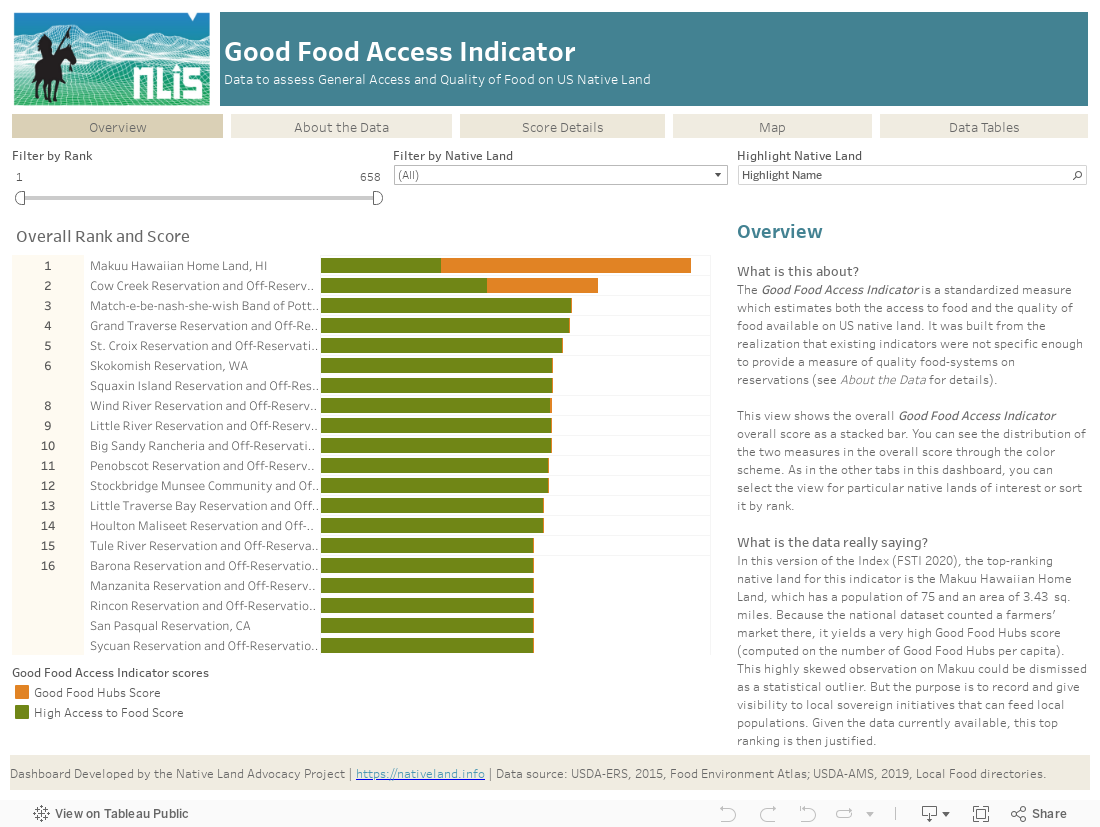
In this version of the Index (NFSI 2020), the top-ranking Native land for this indicator is the Makuu Hawaiian Home Land, which holds a population of 75 on an area of 3.43 sq. miles. Because the only available national dataset counted a farmers’ market there, this land area yields a very high Good Food Hubs score (computed on the number of Good Food Hubs per capita). This seemingly highly skewed observation on Makuu could be dismissed as a statistical outlier. But the purpose is to record and give visibility to local food initiatives that can feed local populations. And given the data currently available (see methods section below), this top ranking is then justified. These results show how a shift in data methodology can change perspectives and emphasize what is really happening in local food-systems. They also call for better data sources for this indicator. The NLIS development team is encouraging users to reach out to the USDA-ERS to enrich the current source for the Good Food Hubs dataset and make it more representative. You can add your food initiative or list thereof with location details to make sure they include it in the next data release by clicking on the button below.

The data used in this indicator had to fill several requirements:
The section below details the process of constructing the measures that compose the Good Food Access Indicator.
This measure is the reversed transformed measure of the Low Access to Store Score found in the Food Environment Atlas produced by the USDA (USDA-ERS, 2015). The variable was selected because it is the only available data that gives a measure of population access to food.
We used the PCT_LACCESS POP15 variable, which provides a percentage of the population with low access to food stores. The measure is described as the “percentage of people in a county living more than 1 mile from a supermarket or large grocery store if in an urban area, or more than 10 miles from a supermarket or large grocery store if in a rural area” (USDA-ERS). Stores considered for their analysis come from a “directory of supermarkets and large grocery stores authorized to accept SNAP benefits merged with Trade Dimensions’ TDLinx directory of stores within the United States, including Alaska and Hawaii, for the years 2010 and 2015”. “Stores met the definition of a supermarket or large grocery store if they reported at least $2 million in annual sales and contained all the major food departments found in a traditional supermarket, including fresh meat and poultry, dairy, dry and packaged foods, and frozen foods”.
Link to Data Source: https://www.ers.usda.gov/data-products/food-environment-atlas/data-access-and-documentation-downloads/
First, the measure was processed in QGIS using Village Earth‘s unique Rez-County Overlap layer, which allows us to estimate Reservation specific values from overlapping counties using AIAN 2019 geographies shapefiles. This layer remains sensitive to data bias due to possible geographical data clusters. Its efficiency is to be assessed on a case by case basis and only works for certain type of data.
Once processed in GIS, the data was extracted and reversed using a simple subtraction calculation, providing an estimate of adequate access to stores in opposition to Low Access. For simplicity purposes, the measure was called High Access to Food. it was then rescaled using min-max normalization to create a comparative measure.
However, it is limited for several reasons. Firstly, it only provides an estimate of access to stores, which focuses on commodified food and large food retailers, and secondly, it greatly disregards nutritional quality. Secondly, the variable is only available at the county level.
This measure is our very own assessment of locally-produced quality food. It is based on the combination of three available sources:
These three lists were gathered from the USDA’s national local food directories, that serve as repository for local food-systems initiatives. The CSAs directory “lists farm or network/association of multiple farms that offer consumers regular (usually weekly) deliveries of locally-grown farm products during one or more harvest season(s) on a subscription or membership basis”. The farmers markets’ directory “lists markets that feature two or more farm vendors selling agricultural products directly to customers at a common, recurrent physical location”. Finally, the food hubs’ directory lists “organizations that actively manage the aggregation, distribution, and marketing of source-identified food products to multiple buyers from multiple producers, primarily local and regional producers, to strengthen the ability of these producers to satisfy local and regional wholesale, retail, and institutional demand”.
Link to Data Source: https://www.ams.usda.gov/services/local-food-directories
These lists were geocoded and compiled into one grand total, which was then calculated as a percentage of Good Food Hubs per capita, in order to decrease biases inherent to acreage discrepancies between reservations. it was then rescaled using min-max normalization to create a comparative measure.
The only lists available at the national scale are the lists provided by the USDA. This is a potential issue because our experience working on native land has taught us that many local food initiatives including community gardens are not recorded by the USDA’s official lists. This is a very important point because it questions the relevance of nationally-collected datasets to assess complex social-economic phenomenon. For us, it also means a possibly huge bias in the representativity of our data. We acknowledge these limitations and invite reservations residents to inform us of necessary changes to perform in the datasets.
In order to provide comparability, both scores were normalized using min-max linear scaling and aggregated into one final measure: Good Food Access Overall Score. Another reason for building a positive score for High Access to Food was to ensure that both measures had the same direction in order to build a coherent overall score.
The Overall score range is [0.000, 2.000] (sum of two normalized scores [0,1]). Most views in the dashboard use this overall score to establish the ranking system, which allows across reservation comparisons. In the map view, the score is visually distributed via a color scheme.
For any details or questions, feel free to contact us on the site contact page.